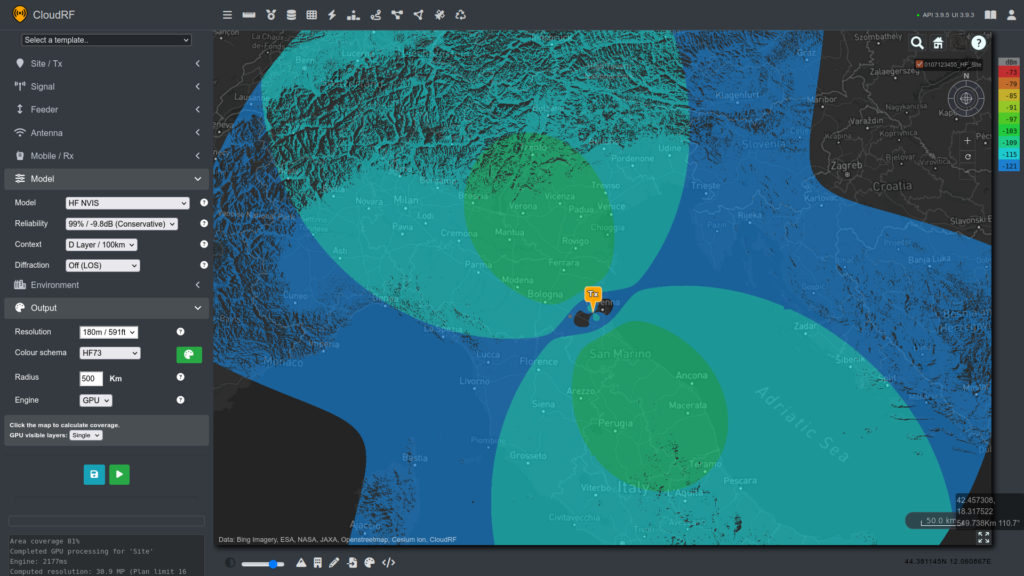
Today we launched a new model for ionospheric communication planning with High Frequency Near Vertical Incidence Skywave (NVIS).
It’s available in the interface and directly via the area, path, points or multisite API calls. The powerful GPU accelerated capability offers a modern way of visualising and teaching NVIS propagation. It does not, in it’s present form, do frequency selection so this must be performed prior to using this tool to visualise the coverage.
Background
This form of basic ionospheric propagation is popular with Military, Maritime and rural customers. With a simple horizontally polarised antenna and the right frequency, an operator can establish a link of up to 500km making this a quick and economical method for communicating long distances.
HF is undergoing a renaissance driven by uncertainty of the availability of space systems and the need for secondary communications in emergency PACE planning. Despite the choice available now with consumer grade space based communications, HF is a low cost method which requires no third parties making it immune to business and geo-political changes.
As HF bandwidth is very limited, historically only CW and voice channels were viable although developments in compression, cognitive radio and now MIMO are changing this. Improvements in software especially mean that reliable data channels with improved throughput are possible which makes HF data links a popular low cost, low bandwidth, alternative to satellite communications.
Ionospheric propagation
The ionosphere describes layers of ionised gas between earth and space which vary in height between around 100 and 300km. These layers reflect (HF) radio waves and attenuate others. As the layers are stimulated by sunlight, propagation changes significantly between day and night. Seasons affect propagation also, so a frequency which is good in the day may become unworkable after sunset.
The D Layer is the lowest layer at around 100km and absorbs low frequencies (2-4MHz). This weakens at night so these frequencies become viable. This determines the Lowest Usable Frequency (LUF).
The F layer is the highest layer at around 300km and reflects higher frequencies between 4 and 8MHz. The critical frequency is the Maximum Usable Frequency (MUF) which changes throughout the day, determined by sunlight.
A useful analogy for considering the change in the layers is a car engine; It warms up quickly in the morning and cools gradually at the end of a day driving. HF layers change quickly at dawn and slowly after sunset.
Higher frequencies beyond 8MHz experience less refraction so pass through the layers out into space. Depending on conditions a higher frequency may be possible but the most reliable (for NVIS) are found between 2 and 8MHz.
Using the NVIS model
The HF NVIS model can be selected in the model menu or in the API as code 12. Like other models it has a configurable reliability (aka fade margin) and a “context”. The context here refers to the refraction altitude and not an environmental eg. urban/rural choice with other terrestrial models.
- Context 1 is the D layer at 100km – (Day)
- Context 2 is the E layer at 200km
- Context 3 is the F layer at 300km – (Night)
In the day you should use the D layer and your frequency should be between 4 and 8 MHz.
At night, you will use the F layer and need a lower frequency between 2 and 4MHz.
This HF model is only for use with a pre-determined frequency. It does not do forecasting or LUF/MUF frequency selection. This functionality will follow.
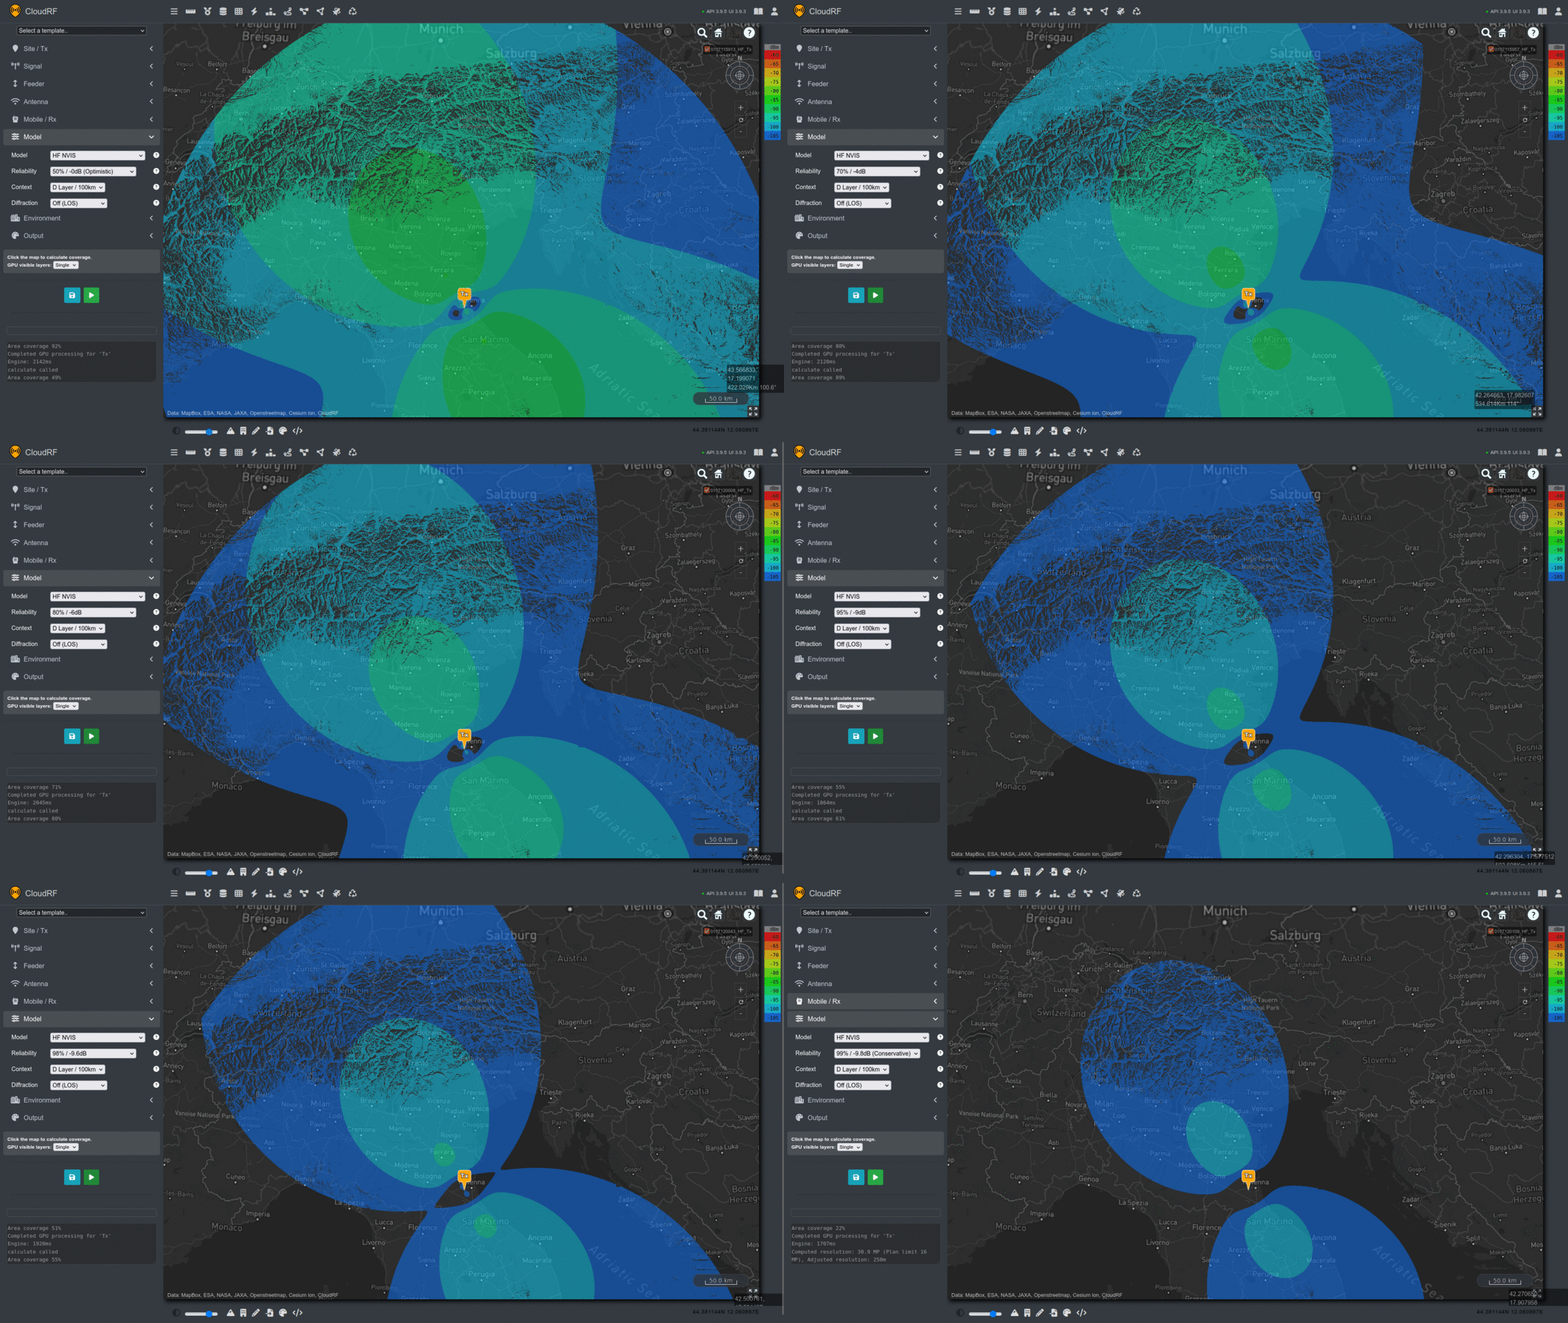
The reliability option provides a 10dB fade margin to tune modelling to match the real world. This was set with 50% reliability aligning to summer predictions with a 5MHz frequency.
HF dipole antenna
The antenna pattern will be a special horizontal dipole. You may set the gain and azimuth only but cannot change the pattern as it has high angle nulls for the skip distance before the reflection hits the earth. This will manifest itself as a cold zone at either end of the dipole where the pattern gain is lowest.
This animation shows a dipole orientated north west. The angle of orientation is measured perpendicular (at a right angle) to the wire so the tips of the antenna will generate the worst coverage, in this case to the north east and south west.
Radius and resolution
The recommended resolution for NVIS is 180m due to the immense size of the problem. Land cover is irrelevant with this mode of propagation. The radius has been limited to 500km in line with API limits. You can go further with NVIS but would run a risk of straying into multi-hop HF Skywave and this capability is focused on one hop only.
Most NVIS communication takes place between 50 and 300km where groundwave ends and the signal fades into the noise floor.
Using the GPU engine we can model a 500km radius with NVIS and terrain in under 3s. Terrain is a small concern to NVIS unless it’s a large mountain several hundred km away. In this case you will experience shadows due to to low angle of incidence but compared with shadows from terrestrial communications, it will be small.
Environment layers such as land cover and buildings should be off. They will be ignored at 180m resolution.
The colour schema can be whatever you like but if you want to align with the ‘S’ meter scale, popular with HF, where a barely workable signal is S1 and the best is S9 (-73dBm) use a max value of -73dBm with 6dB bands for S9 to S1.
Accuracy verification
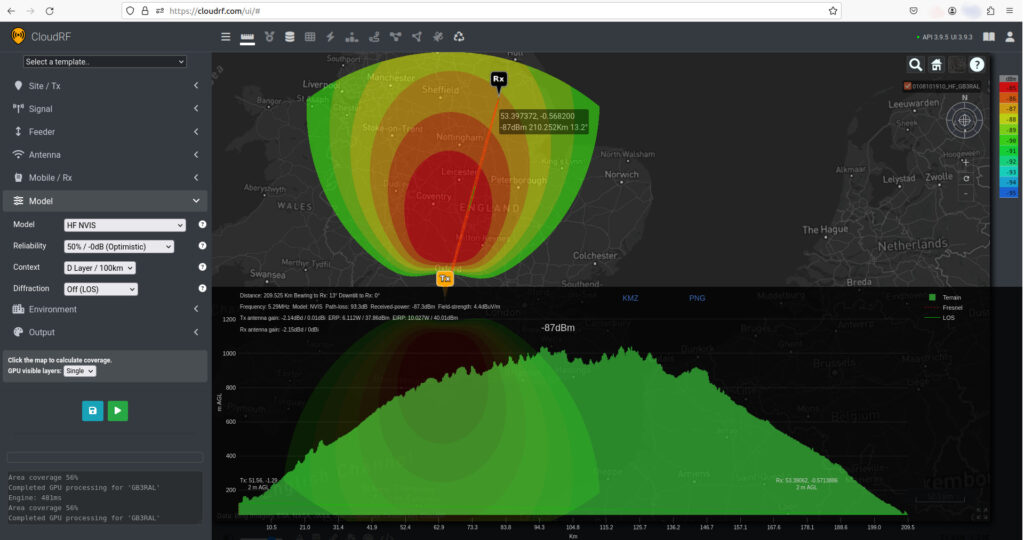
We have calibrated our NVIS model to align within 10dB of measurements taken from a 2012 research paper by Marcus Walden using a 5MHz NATO frequency in the UK. From this paper we selected one of the longer links at 210km where we used the median measurement value which for August 2009 was lower during the day than VOACAP, a popular open source application for HF forecasting. The median dBW measurement at noon was -120dBW (-90dBm).
Noting that the RMS error between the VOACAP predictions and the measured values was concluded to be 7 to 12dB at 12 noon (Ref table 7 on page 8), and more at night, we have tuned our model so an “optimistic” prediction is 3dB from the noon measurement. The context and reliability options provide sufficient control to allow predictions to align with current and local ionospheric conditions.
The screenshot below shows both the path and the area coverage aligning with a 1dB calibration schema. The link has over 900m of curvature height gain which explains why a flat region of England appears as a mountain!
Ionospheric modelling is less predictable than terrestrial modelling due to unpredictable solar radiation. Predictions generated with this model are useful for training, situational awareness and antenna alignment but cannot provide an accuracy greater than 10dB, assuming the inputs are correct.
Look forward: Space weather and long range HF
HF forecasting tools use lookup tables to set refractivity during both seasons and times of day. Using quality, and current data, improves accuracy but like weather forecasting it cannot offer accurate predictions without live data, in this case space weather which has seen a lot of renewed research recently. Our implementation does not use forecasting data presently so users should not be using it to pick their frequencies, but it will help visualise the coverage and align antennas – which at 500km is important.
For the next phase of HF, long range skywave, we will use a space weather feed to offer high resolution HF predictions. Long range HF uses multiple hops at lower angles so the space weather and time of day must be considered along the route which may be thousands of kilometers….


