Our latest field test was focused on drive testing novel antennas by UK SME Far Field Exploits (FFX) around the Somerset countryside with Trellisware radios.
Previously, we validated diffraction models using LTE800 in the Mountains. The outcome of that cold test highlighted Deygout as the most accurate diffraction model when paired with empirical cellular models. For this much warmer antenna drive testing, we used lower frequencies and a lower mast in an area with many trees which presented a challenge for both legacy cellular models and LiDAR.
Testing highlights
- Average Root Mean Square Error of 7.4dB
- Average Modelling Error of 4.4dB
- Automated data collection with ATAK plugin
- New “General Purpose” model developed
- New “GP” clutter profile for use with GP model
Test setup
The test area was in and around the small town of Somerton in Somerset. This town sits in rolling countryside featuring farms, high hedgerows and blocks of trees. A railway line with road humpback bridges bisects the town. The town has a small housing estate under construction which did not feature in our buildings data.
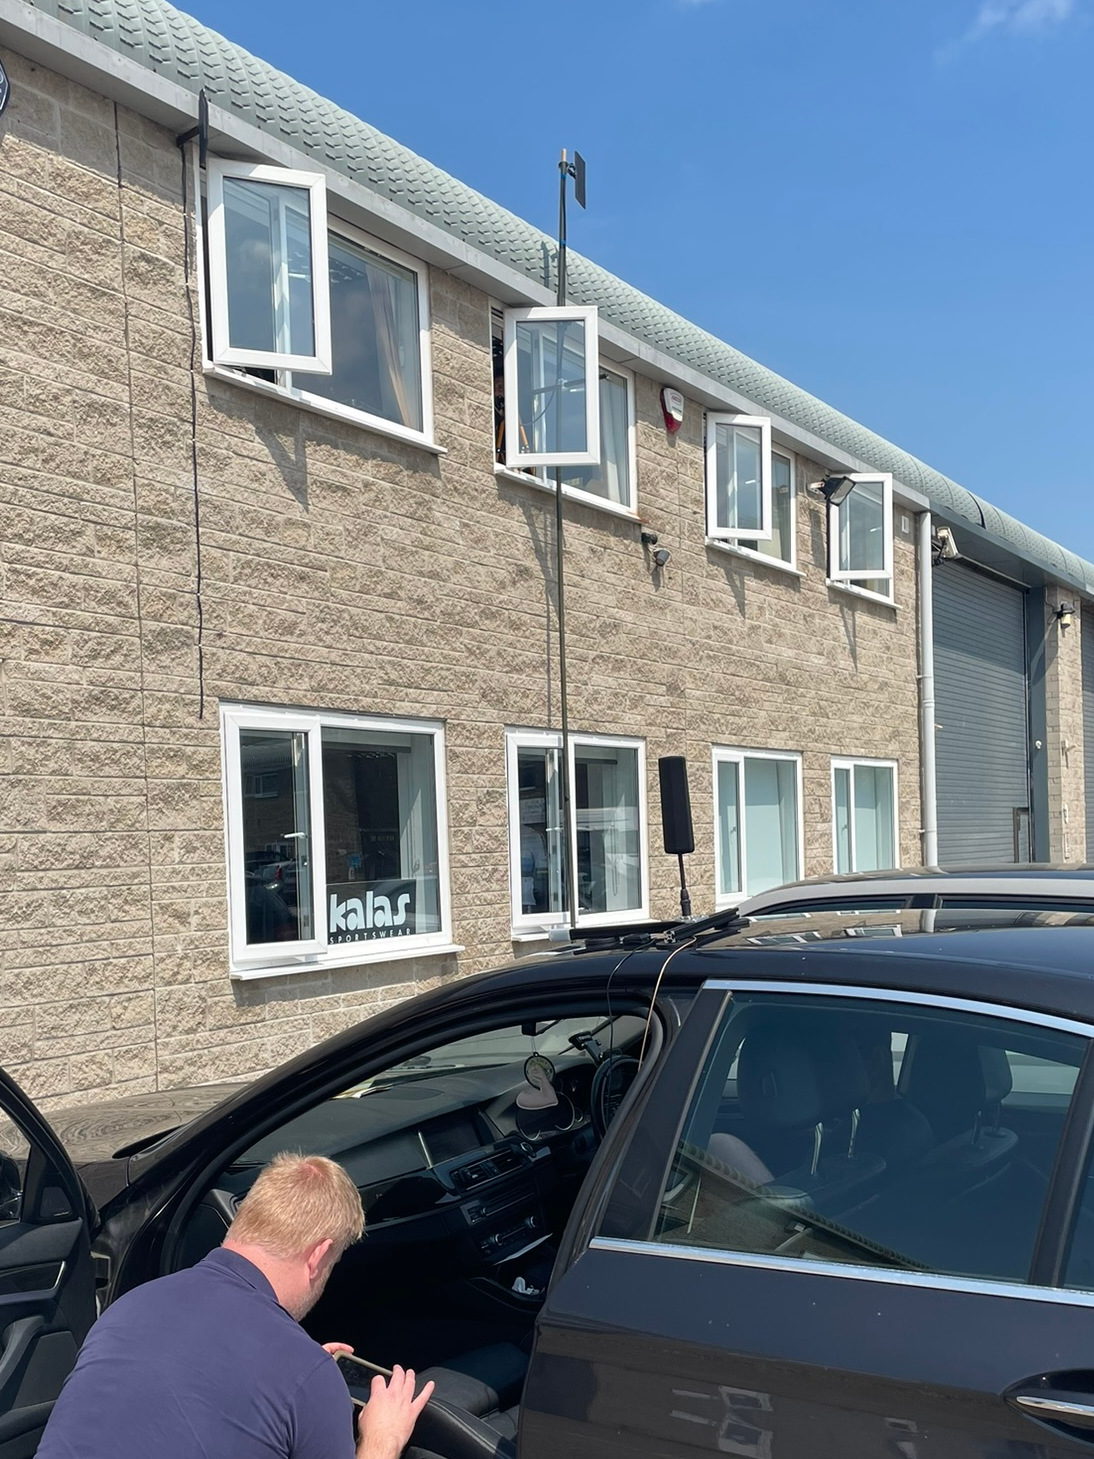
The base station was a wide-band Omega panel elevated 5m above the ground and connected to a Trellisware spirit radio. The radio was operated across several UHF bands, each with 1.2MHz bandwidth, and live positions observed on WinTAK using cursor on target (CoT).
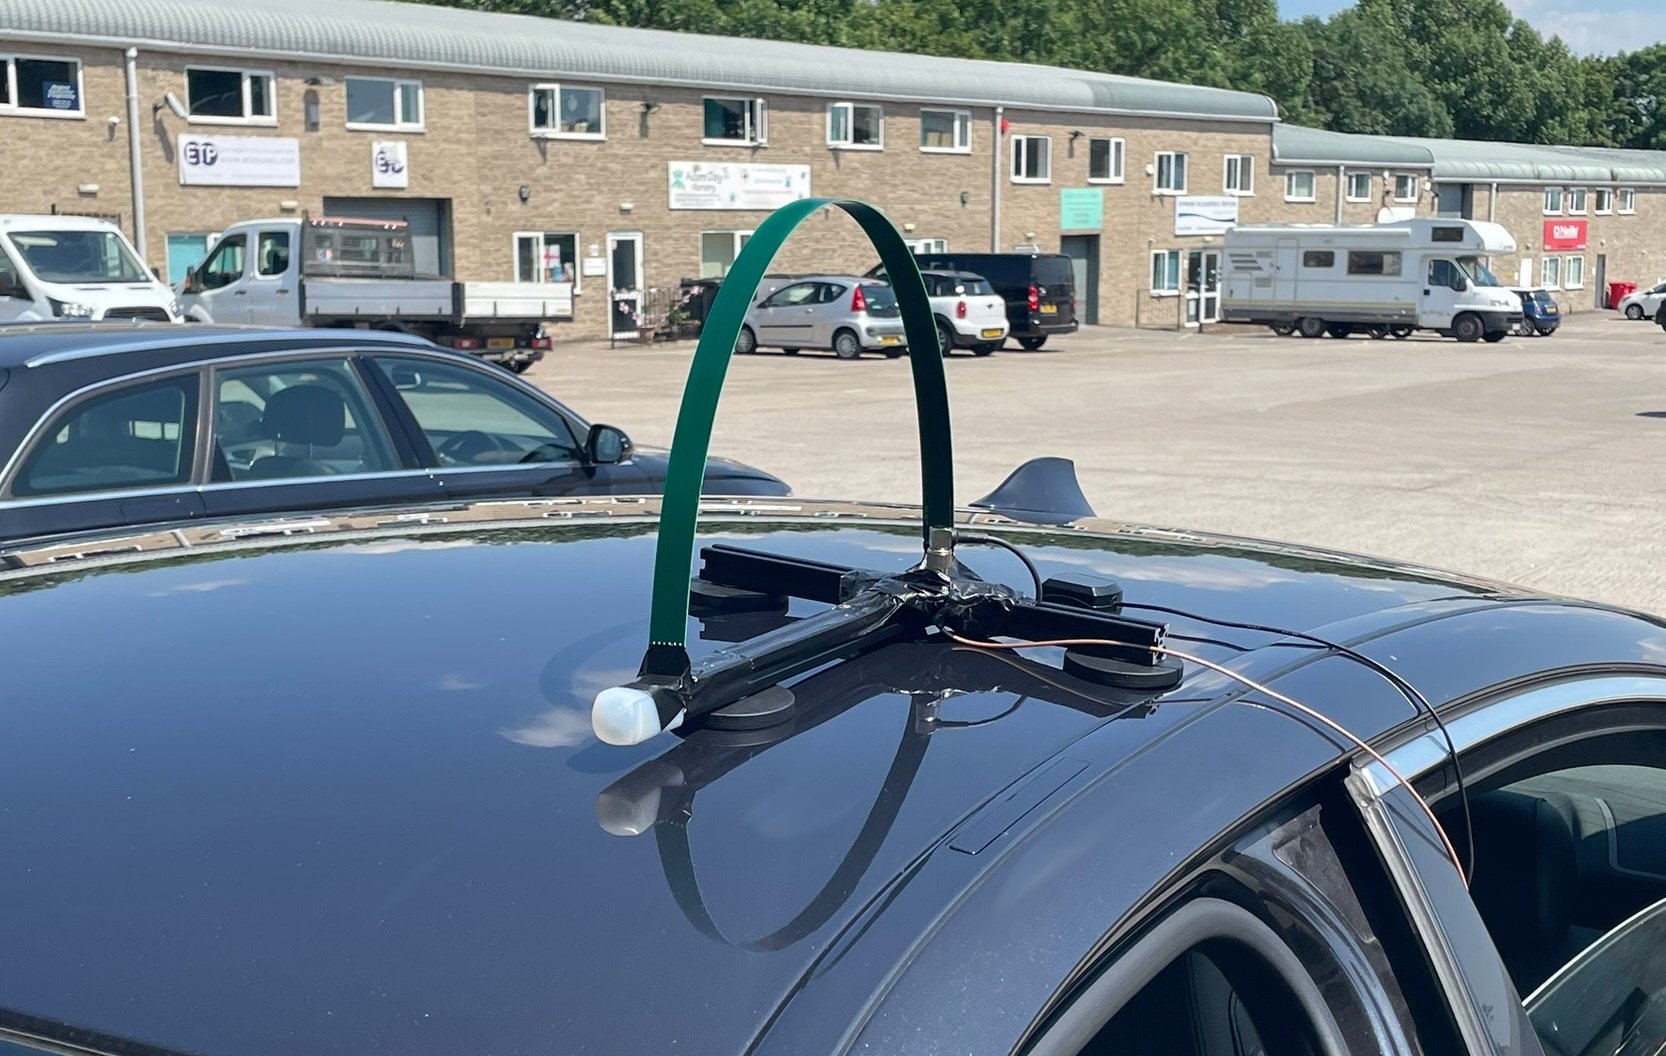
The antenna testing vehicle was fitted with a roof mounted magnetic antenna bracket which connected to a spirit radio. This mount allowed different antennas to be swapped out. As a result we were able to test both a Hascall Denke MPDP675X4 and a FFX Sigma 3.
Data logging
We know customers and OEMs like to voice opinions about radios, waveforms and antennas but without solid measurement data it’s just noise with a lot of bias and emotion.
Data beats emotions every day!
As an antenna OEM, FFX developed the ATAK spectrum survey app to streamline collection of field measurements for antenna testing in different environments.
The logging application used the Trellisware radio’s API to fetch link metadata from the local radio and save it to the SD card as a CSV file.
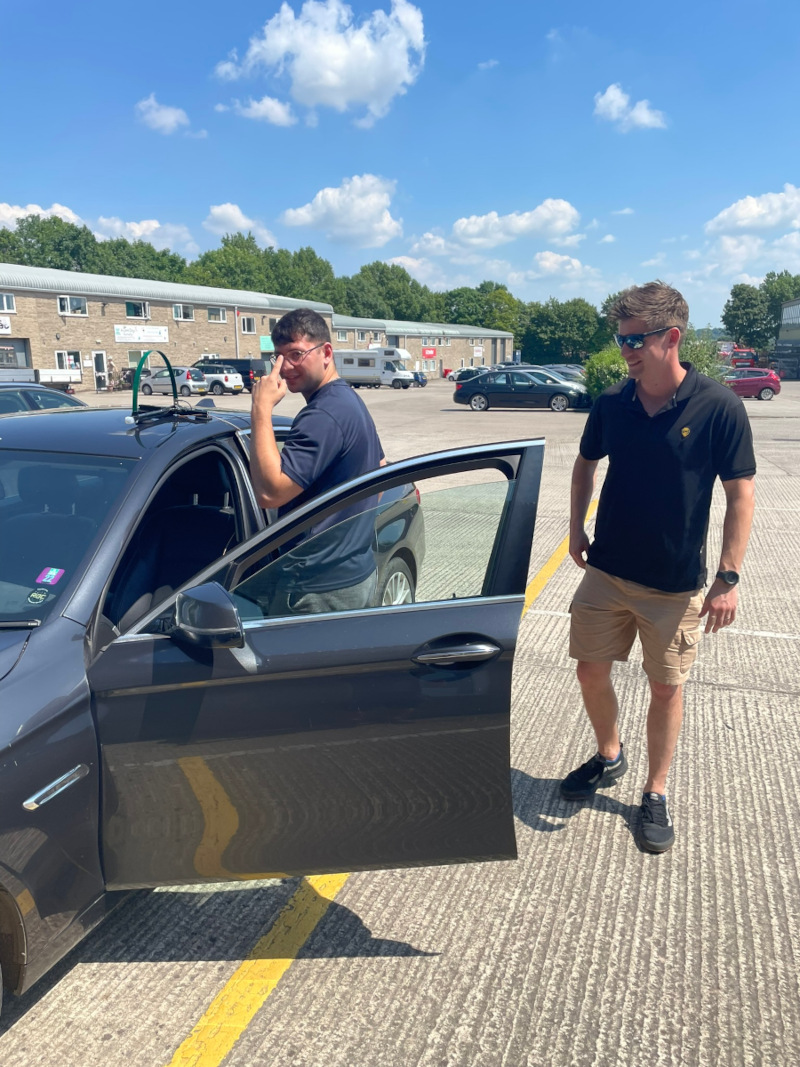
The ATAK plugin enabled a large quantity of high quality measurements to be efficiently collected. As a result we were able to execute several test cycles in a short space of time – just as well as it was hot (for the UK) and Harry had no air conditioning…
The CSV files were downloaded from the phone and loaded into the CloudRF calibration utility for analysis.
The survey data was filtered to remove results weaker than the theoretical noise floor at -113dBm.
We were planning to use a measurement error of 2dB for the high quality radios (a cell phone is 3dB) but owing to the high temperate of the mobile radio in the car we used 3dB as receiver performance degrades with temperature.
At first look
The first pass comparison of the data showed a ~15dB delta between modelling and field measurements with LiDAR, prior to tuning. Using the ITM model and a high reliability value (99%) this only reduced several decibels and clearly needed more work. Ideally the model should align within 10dB so clutter tuning can then be used to reduce this towards 6dB.
ITM uses the complex Vogler multi knife edge diffraction model which is accurate for hills but needs tuned clutter to handle soft obstacles. Using cellular models, as we did in LTE800 field tests, didn’t produce the same results due presumably to the lower mast height and frequencies, even when enhanced with Deygout diffraction.
A new model
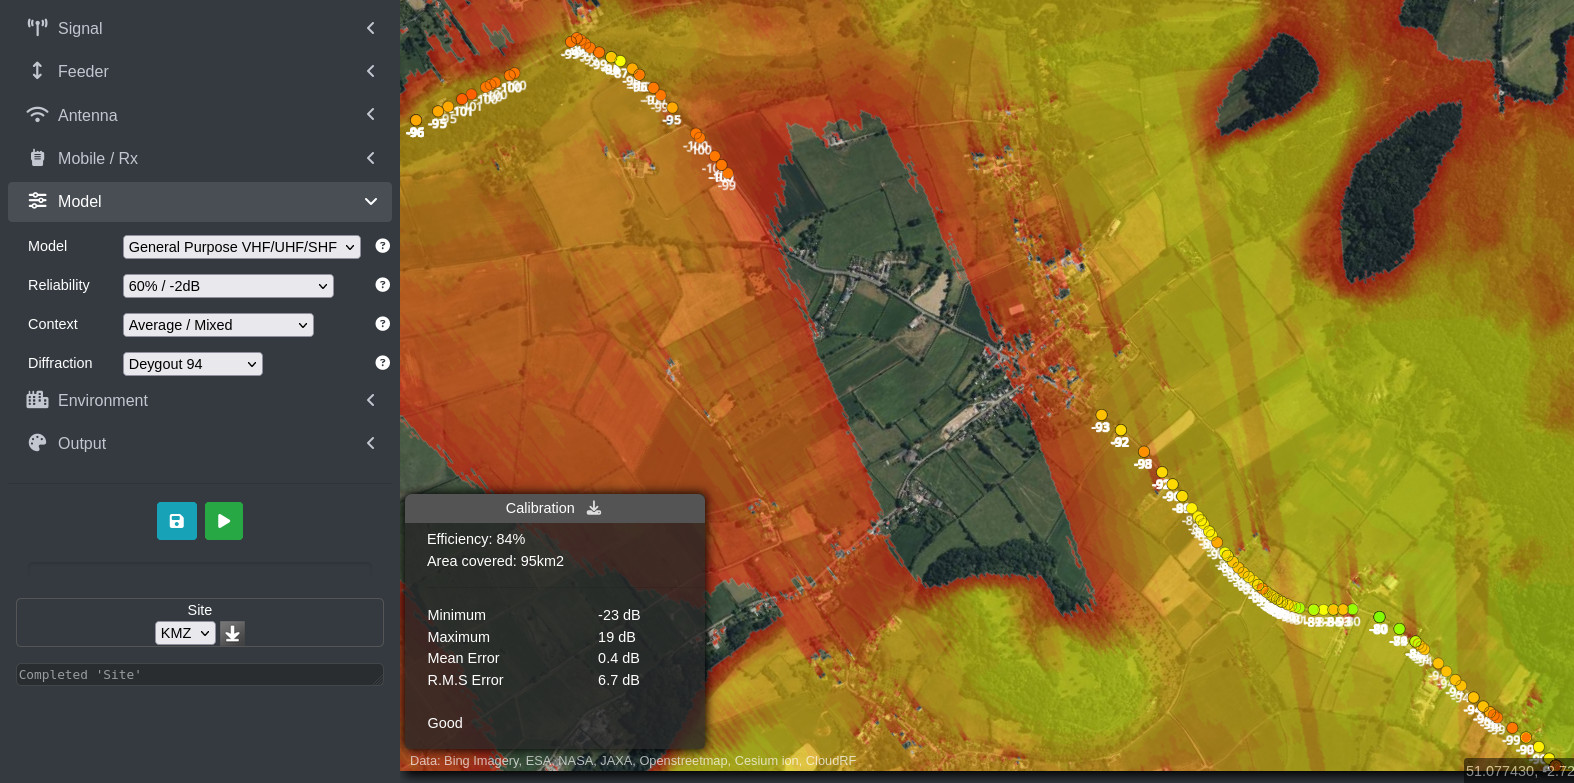
Through curve fitting we identified alignment with the P.525 reference model and a 20dB constant representing observed system losses. When enhanced with the Deygout 94 diffraction model this produced excellent alignment with the more challenging beyond-line-of-sight areas. Many signal paths on the route had multiple obstructions so a multiple knife edge model (MKED) was essential.
We have created a new model from these settings called the General Purpose Model. It is frequency and height agnostic which makes it ideal for ground and air based links and much more versatile than empirical equivalents which must be operated within a restricted performance envelope. Like all our models it must be used in conjunction with a diffraction model and tuned clutter to deliver accurate beyond line of sight results.
In our opinion, modern developments in processing and clutter data especially have rendered legacy empirical models largely obsolete. The modern way to fit modelling to measurements is to focus on precise clutter data not old path loss curves.
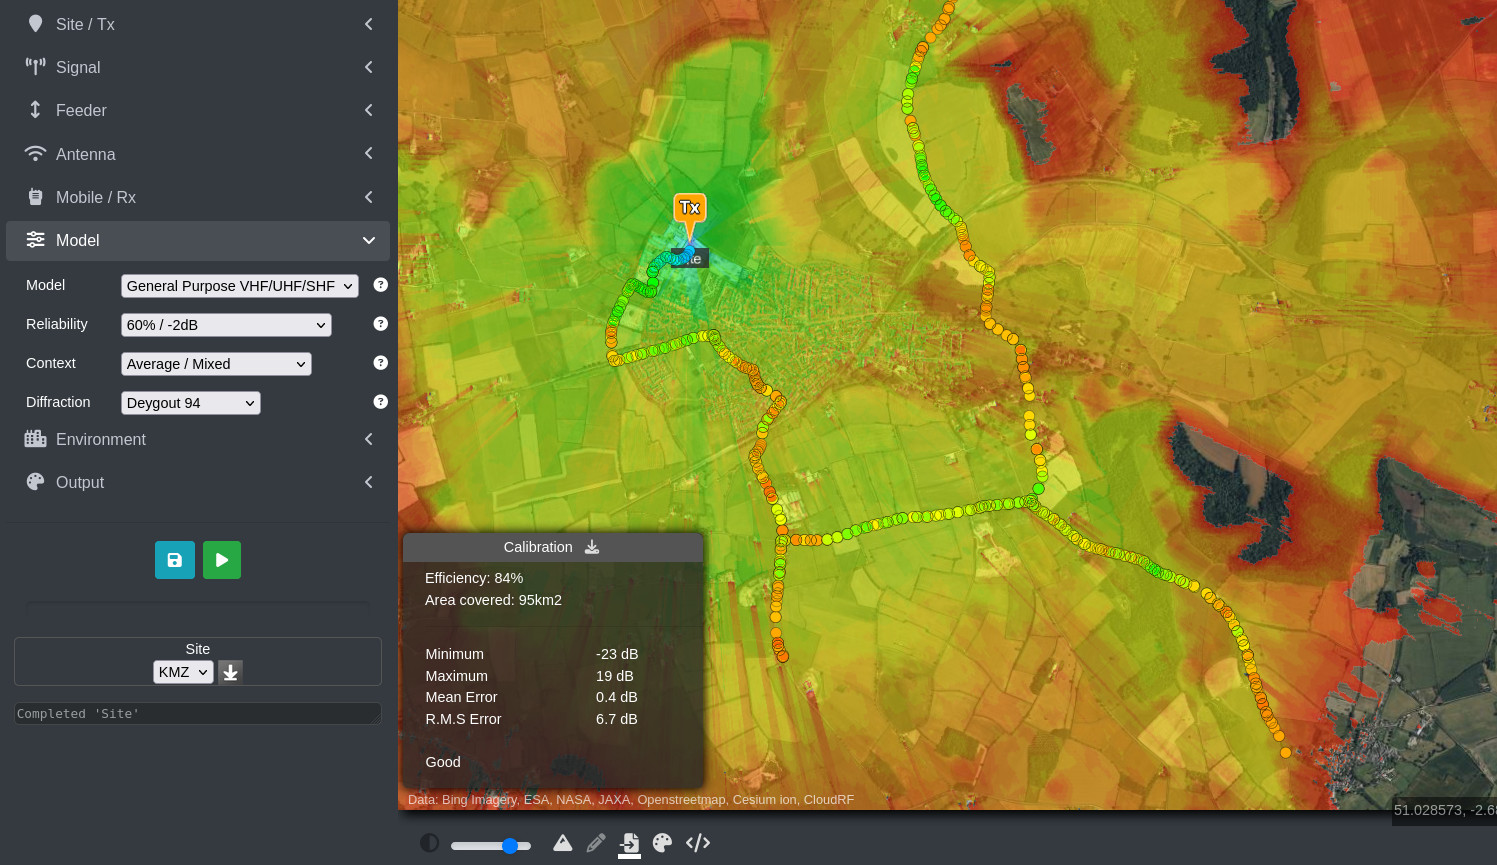
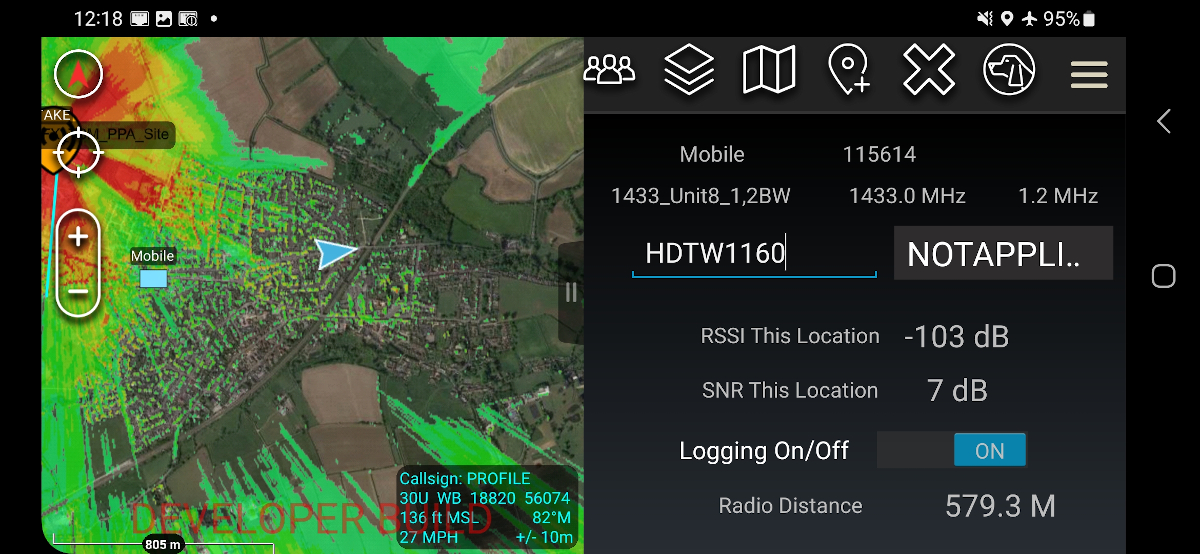
In the screenshot below, the car drove up a hill where it fell off the network behind a prominent knoll before reacquiring the network later on. This knoll was the second of two obstructing hills for this section of the route. The modelling predicted more coverage due to the chosen receive threshold, -107dBm, which was based upon 6dB above the thermal noise floor which was -113dBm at 1.2MHz bandwidth. It is very likely local noise was slightly higher.
ITU clutter values
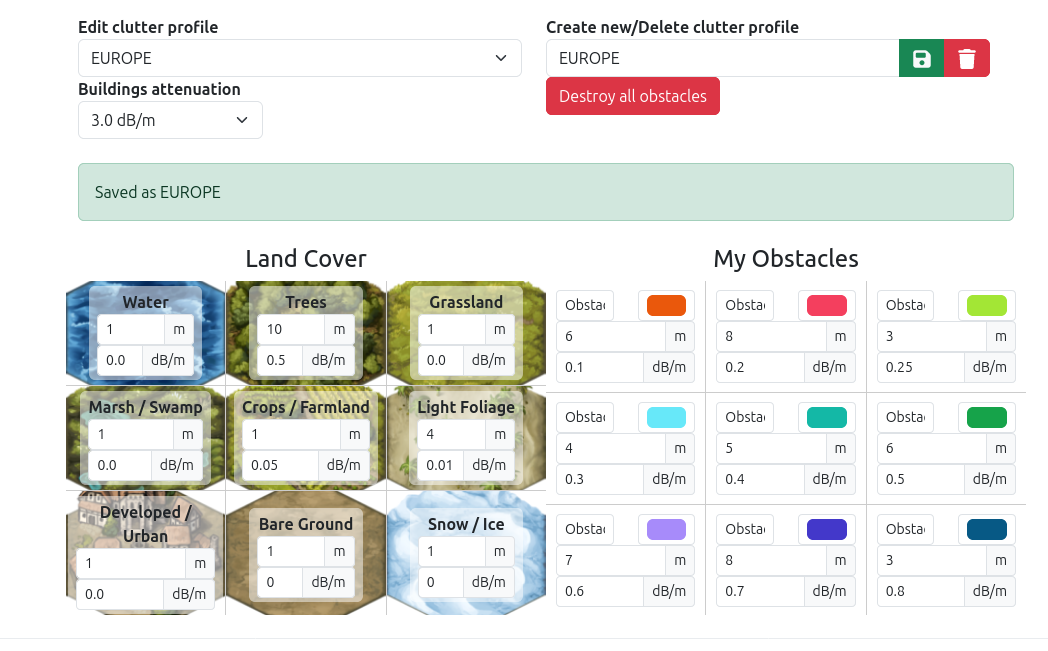
Without clutter, the General Purpose (GP) model will be optimistic in most ground environments. It will be accurate over bare earth but where obstacles are present, it needs land cover and a clutter profile. Prior to developing the GP model, we did most of the tuning in the model using reliability (%) and only fine tuned with the clutter.
This is why older CloudRF clutter profiles eg. Minimal.clt have low values such as 0.05 dB/m for trees. With the GP model, the model itself is very simple and most alignment takes place within the clutter (profile). As a result, the clutter values used for GP are much denser. Our GP profile, created for this test has trees with a density of ~0.5dB/m, aligning with ITU-R P.833, attenuation in vegetation.
Diffraction logic has been re-balanced to accommodate ITU clutter values. Users using either the default ITM model or models without land cover are not affected. Legacy clutter profiles such as Minimal have not changed but you are advised to try the new GP model and associated GP clutter and see the difference for yourself.
Test parameters
Bandwidth: 1.2Mhz
Feeder loss: 1dB
Receiver height: 1.5m
Receive sensitivity: -107dB (6db above noise)
Noise floor: -113 dB
Model: General purpose / ITM
Reliability: 60% / 90%
Context: Average
Diffraction: Deygout 94 / Vogler (ITM)
Clutter Profile: Buildings 3dB/m, Trees 10m @ 0.5dB/m
Radius: 6km
Resolution: 5m
Results
The following table of results were from measurements conducted with the same base station, vehicle and radios. Only the vehicle antenna, and frequency, were changed in between tests. Once calibration had been achieved the area covered was extracted from the modelling. This is typically inverse to the frequency so a low frequency has better coverage than a high frequency at the expense of bandwidth – and both matter.
There are two standout results from the data: First is the low RMSE accuracy for the new GP model with tuned clutter compared with LiDAR which is satisfying given the challenging terrain and the second is the performance of the Sigma 3 on a frequency it is not officially rated for as it has a bottom end of 350MHz. The best alignment with the same settings was found to be with -5dBi receive gain confirming the antenna can be operated lower, and at range.
Once again, DTM with clutter has proven to be superior to LiDAR.
| Antenna test | Model + Diffraction | Clutter profile | DEM | Receive gain dBi | RMSE error | Modelling error | Modelling area covered km2 | Modelling area covered % |
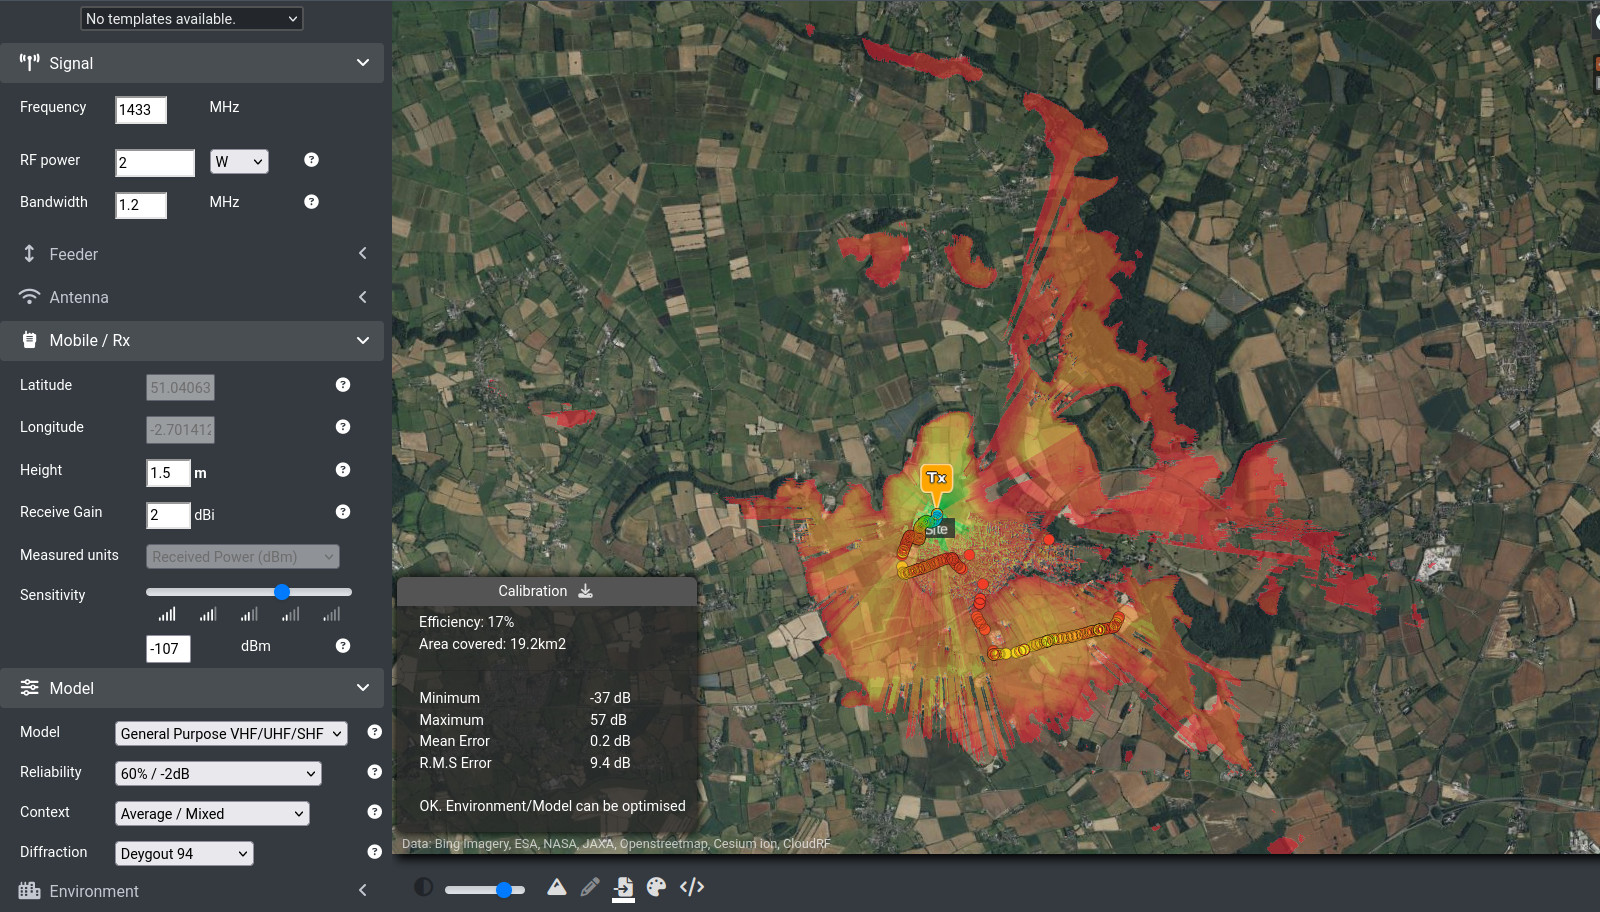
| Hascall Denke MPDP675X4 on 1.4GHz | GP (60%) + Deygout 94 | GP | DTM + 10m Land cover + 2m Buildings | 2 | 9.4 | 6.4 | 19.2 | 17 |
| Hascall Denke MPDP675X4 on 1.4GHz | ITM (90%) | N/A | LiDAR | 2 | 15.2 | 12.2 | 12.4 | 11 |
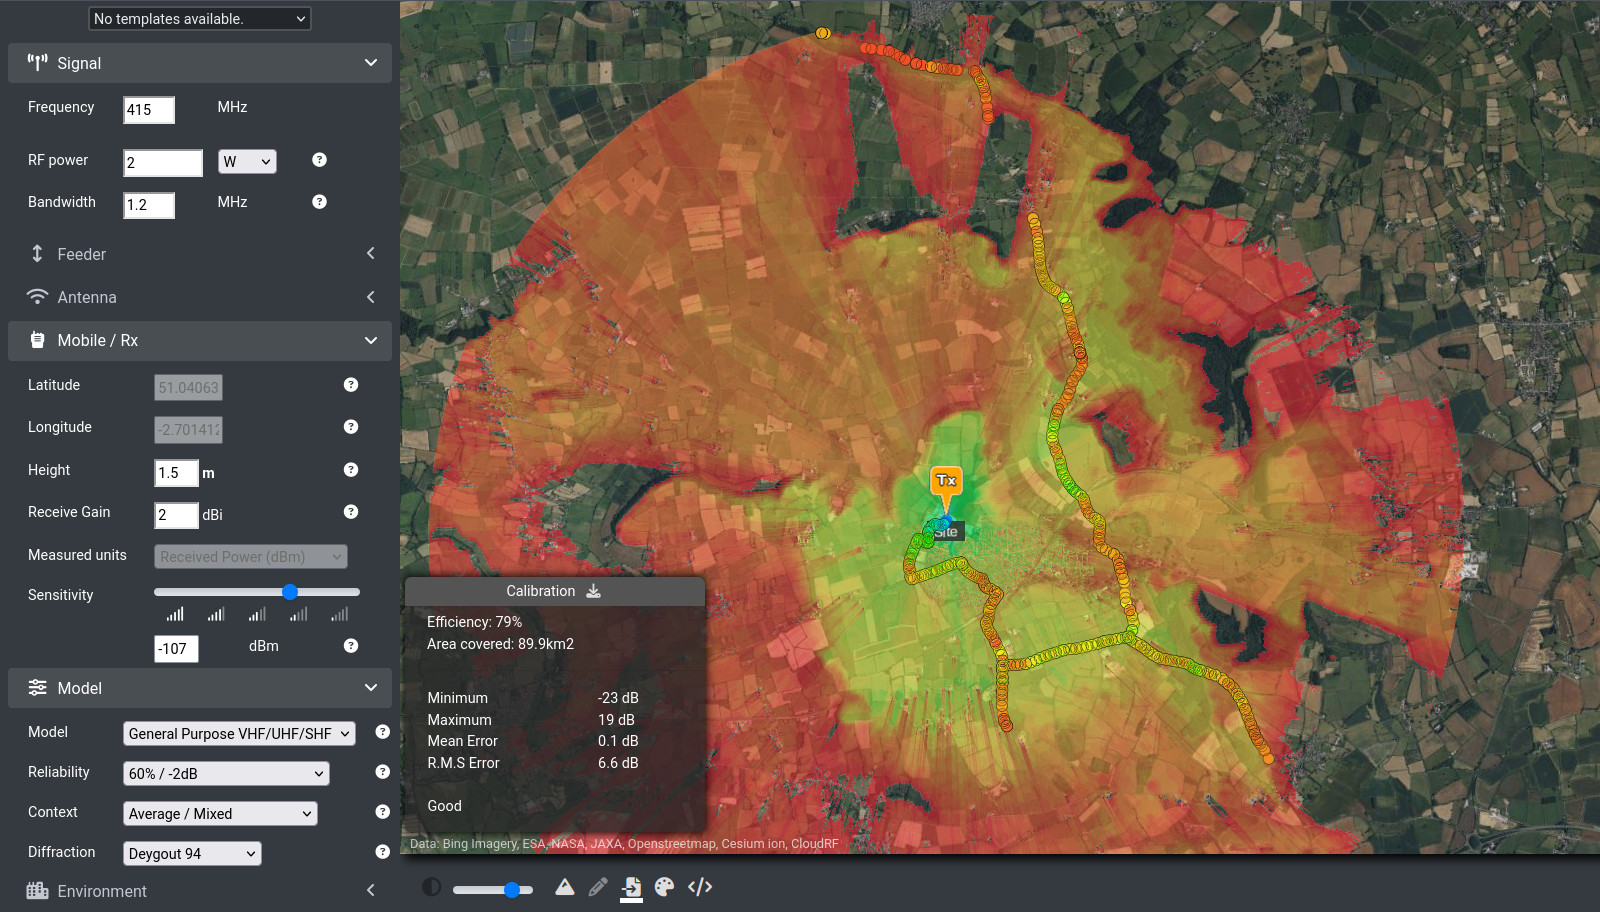
| FFX Sigma 3 on 415MHz | GP + Deygout 94 | GP | DTM + 10m Land cover + 2m Buildings | 2 | 6.6 | 3.6 | 89.9 | 79 |
| FFX Sigma 3 on 415MHz | ITM (90%) | N/A | LiDAR | 2 | 18 | 15 | 72.7 | 64 |
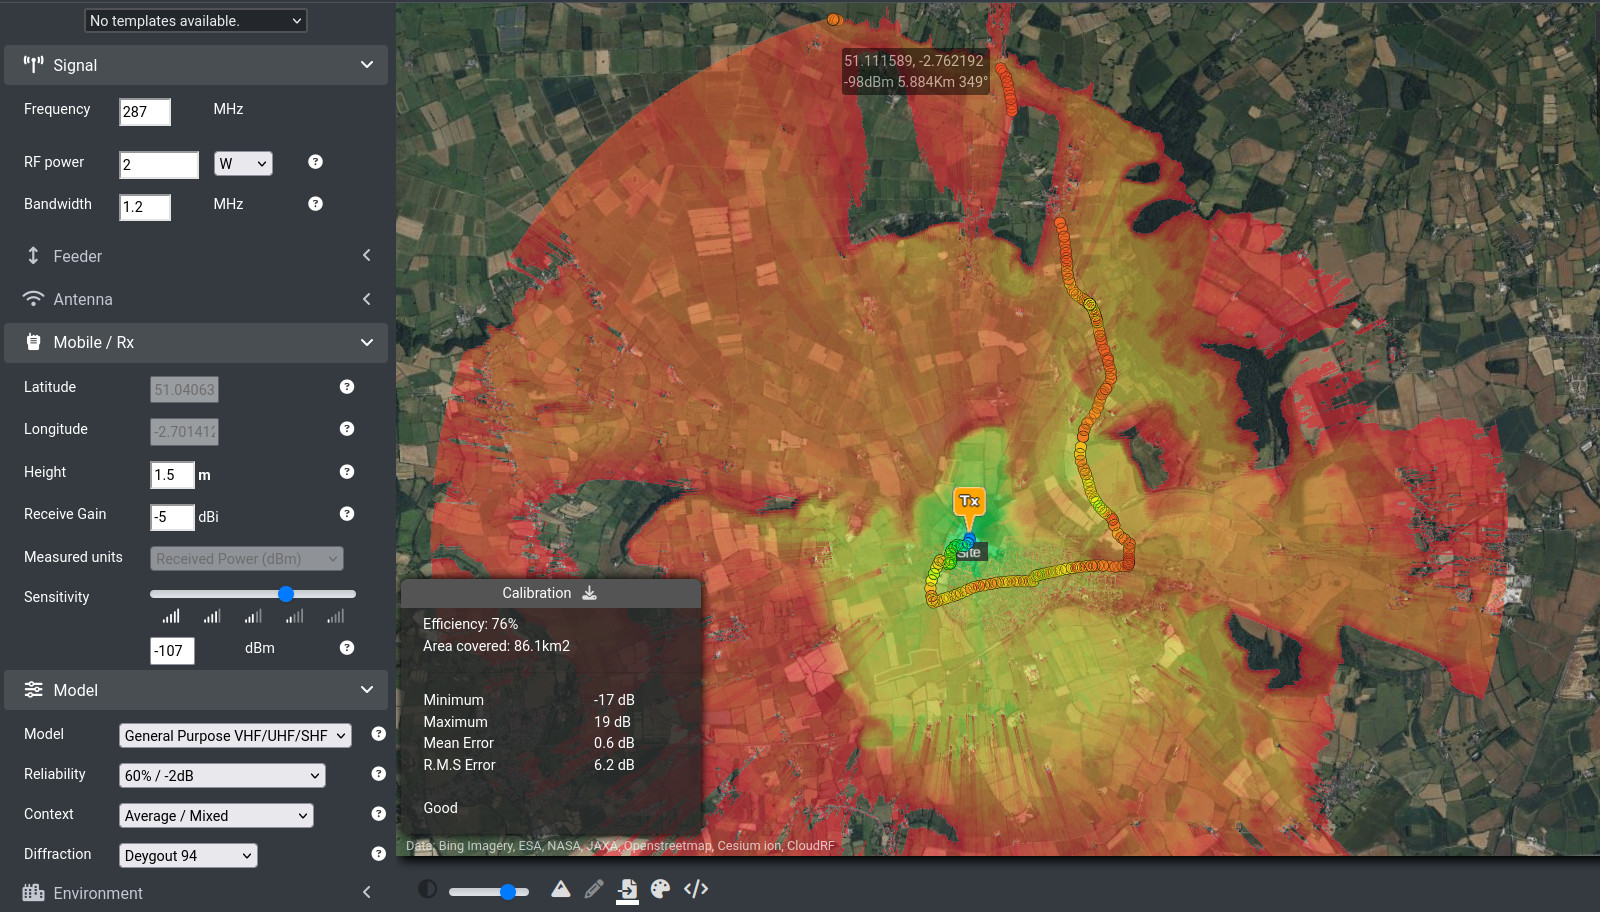
| FFX Sigma 3 on 287MHz | GP + Deygout 94 | GP | DTM + 10m Land cover + 2m Buildings | -5 | 6.2 | 3.2 | 86.1 | 76 |
| FFX Sigma 3 on 287MHz | ITM (90%) | N/A | LiDAR | -5 | 15.1 | 12.1 | 63 | 56 |
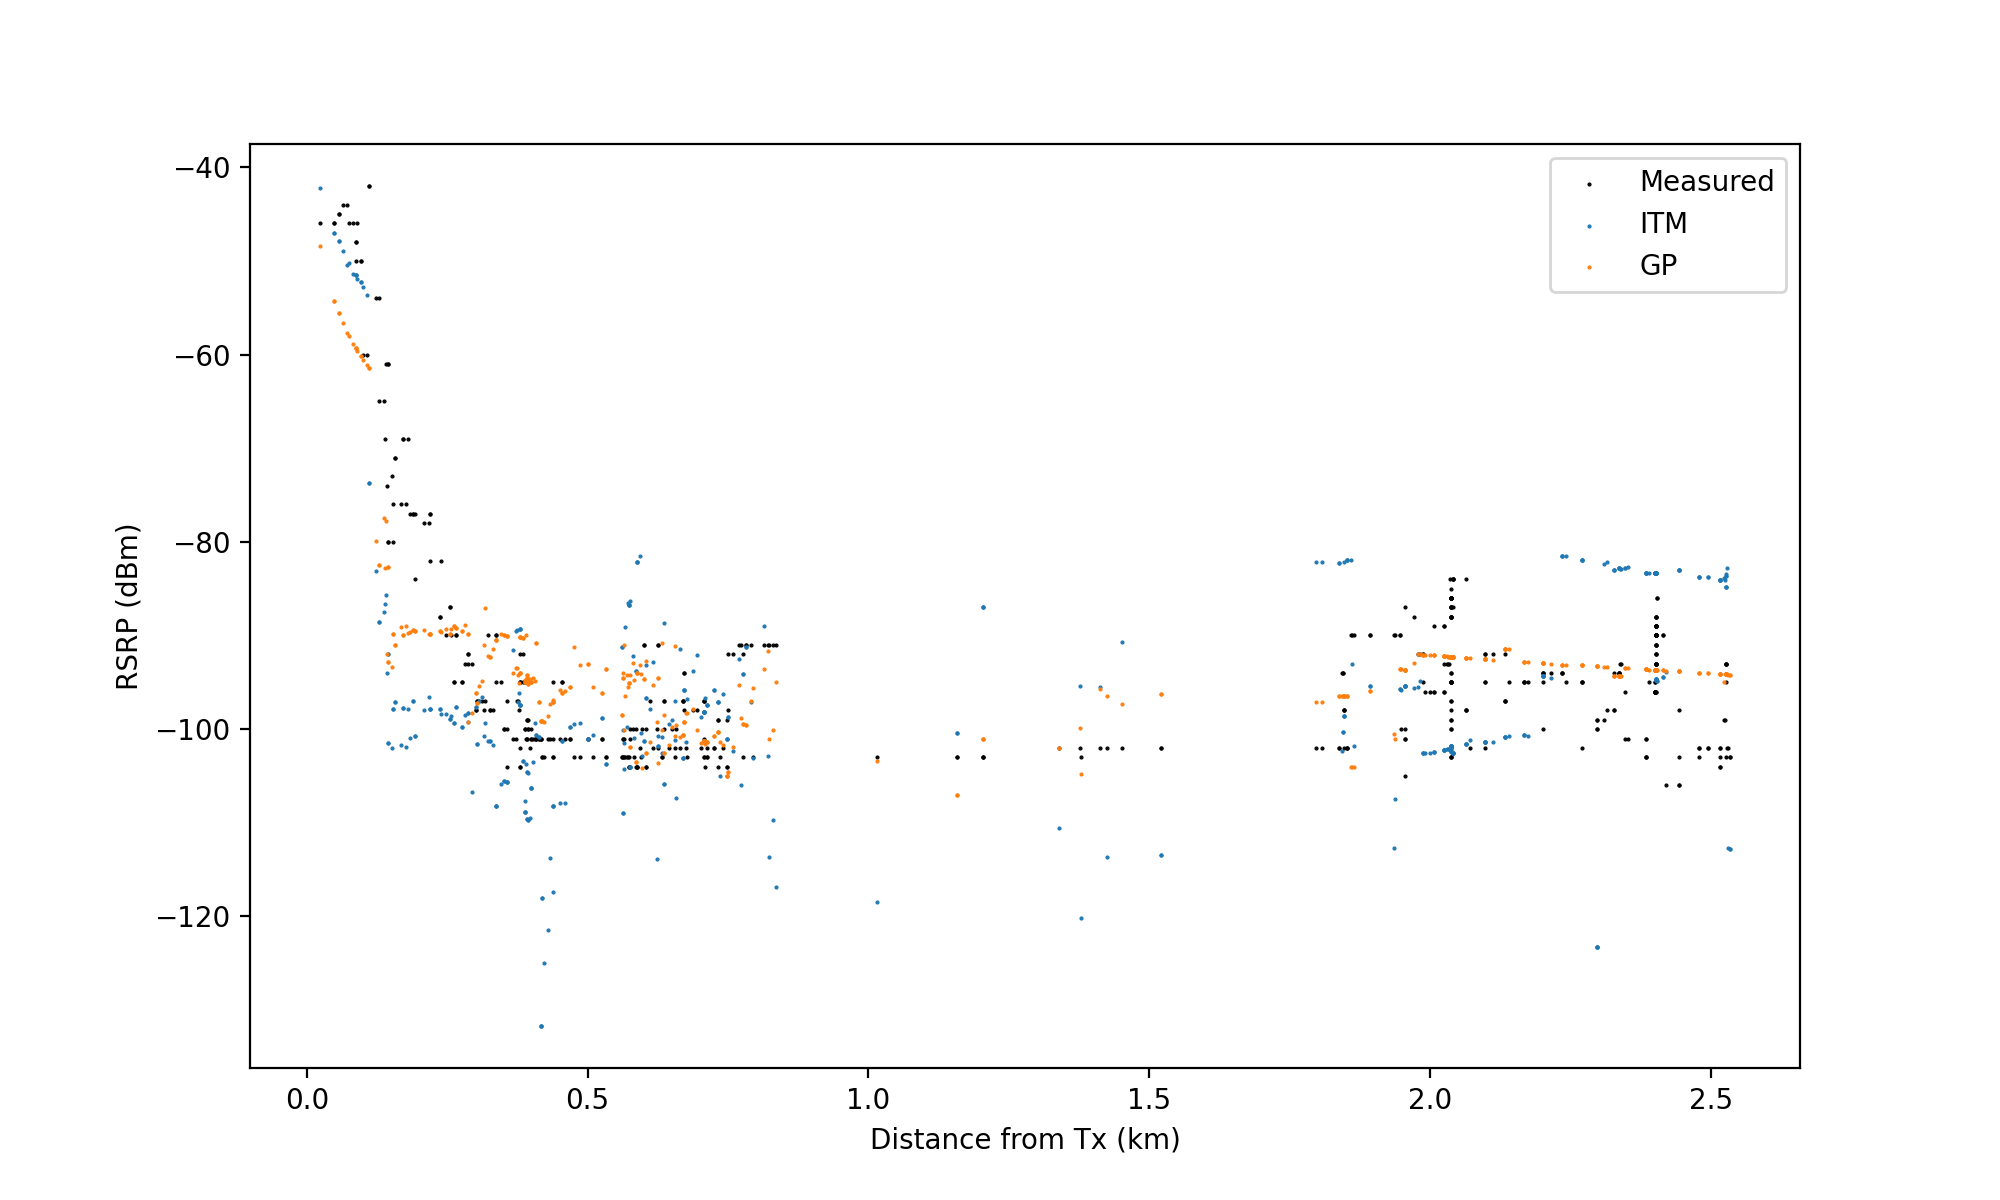
The scatter plot for the 1.4GHz data shows the simple GP model to align closer to field measurements than the much more complex ITM model. Our conclusion is that the ITM model, and it’s Vogler diffraction, developed in the 1960s, pre-dates developments in computing and precision clutter so provides good performance across multiple hills, at range, but is inadequate for macro planning at “street level” resolution where density of obstacles must be budgeted for.
ITM continues to be a solid UHF broadcasting model but it was designed for hard obstacles. Retro fitting it with soft clutter, as we have done can improve its performance several decibels but for maximum accuracy, the simple General Purpose model with tuned clutter provides superior results.
Results Gallery
Tuned coverage and survey data is displayed on the same map showing the RMSE and Mean error.
Look ahead
The General Purpose model will go live on CloudRF in early July 2024 following more testing and then into SOOTHSAYER 1.8 later in the year.