A popular question when modelling GSM / UMTS / TETRA / LTE networks is how can I show the coverage from the mobile subscribers (Uplink)? Showing a tower’s coverage (Downlink) is easy but how do you go the other way back to the tower? If you know your equipment capabilities (tower and subscribers) you can calculate link budgets for both the uplink and downlink and then use those values to perform an area prediction. Here’s a simple example with the GSM900 band and without some of the other gains and losses which can complicate this for the benefit of novices. You can always add in your own gains and losses where you like to suit your needs.
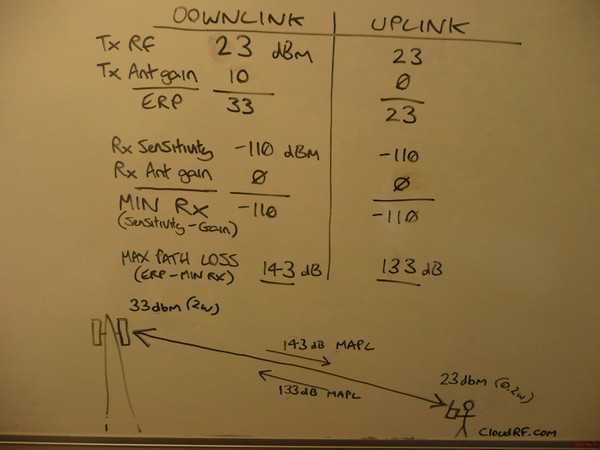
1. Calculate the total effective radiated power for the BTS tower by adding the power and antenna gain (Limited to 33dBm in the UK)
2. Repeat for handset (Limited to 23dBm in the UK)
3. Calculate the minimum receive level for the BTS by subtracting the receive antenna gain from the receiver sensitivity eg. -110 – 10 = -120
4. Repeat for handset
5. Calculate the maximum allowed path loss (MAPL) by subtracting the minimum receive level from the ERP.
6. Repeat for handset
A balanced network will have similar values. If your base station can radiate for miles but your handsets cannot you have an unbalanced and inefficient network.
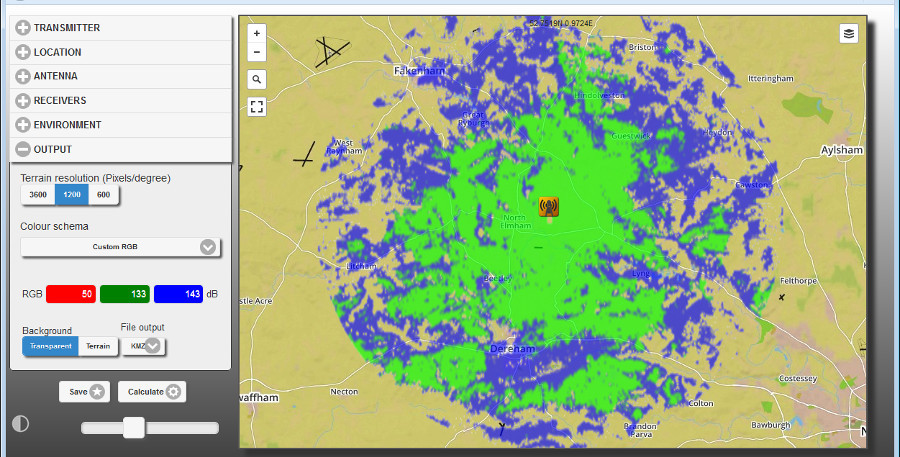
Finally, to see this on a map, use the ‘Path loss (dB)’ output mode in CloudRF along with the ‘Custom RGB’ colour schema. Enter the uplink value into the green box and the downlink value into the blue box and run the calculation. A typical cell site will have a greater reach (blue) than it’s subscribers (green). The system will automatically factor in the effect of terrain, ground absorption, antenna heights to give you an accurate prediction.