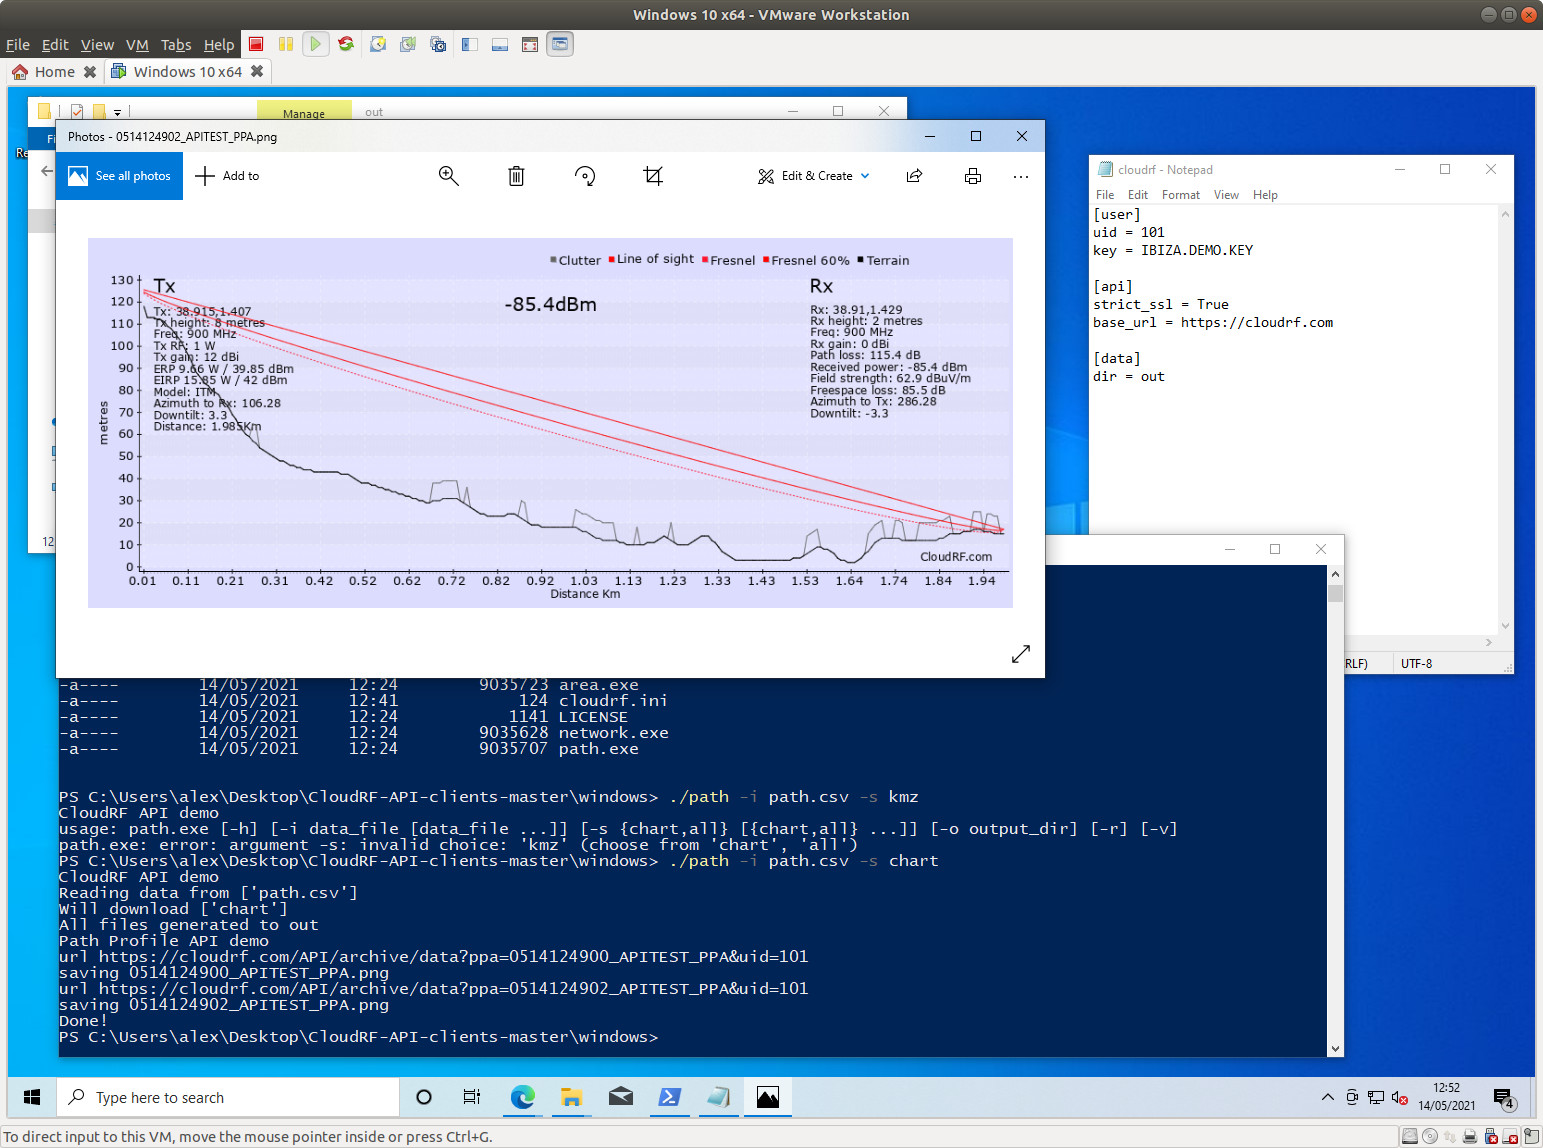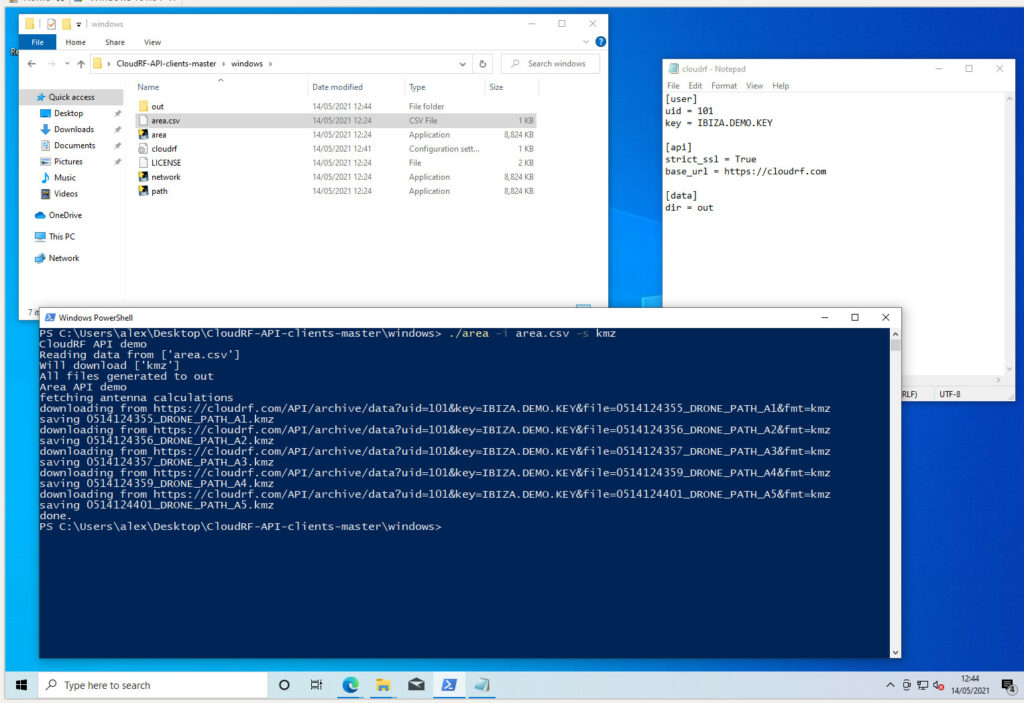
Using the CloudRF API 2.0, you can process an entire spreadsheet of site data in one go to make a complete network coverage map. This tutorial assumes you are a Windows user with minimal programming experience. It uses the free scripts available to download as a ZIP from
https://github.com/Cloud-RF/CloudRF-API-clients
Power users can use the Python clients to integrate into their back-end system(s) for a light but powerful upgrade to your workflows. Trust us when we say our 32C servers are more powerful than yours!
1. Prepare your data
Your data needs to be in a basic comma separated CSV spreadsheet (known as MS-DOS CSV format in Microsoft Excel). The top row should be column headers defined at https://cloudrf.com/documentation/developer/ but can be whatever names you like so long as they map to the JSON request template.
You can find example CSV files called ‘area.csv’ and ‘path.csv’ in the examples or download them from here:
Sites template
The CSV file is used for variables like location.
https://github.com/Cloud-RF/CloudRF-API-clients/blob/master/Windows/3sites.csv
Hardware/request template
The JSON file used for fixed values like power. Note it has placeholders which map to variables in the CSV…
https://github.com/Cloud-RF/CloudRF-API-clients/blob/master/Windows/drone.json
2. Setup your configuration file
Open a console in the ‘windows’ folder (Shift right click to open the power menu) in the folder you unzipped and run area.exe with no arguments. This will create a blank ‘cloudrf.ini’ file. Edit this file in a text editor so it contains your credentials and a destination folder for files, relative to your location:
[user]
key = 101-IBIZA.DEMO.KEY

[api]
strict_ssl = True
base_url = https://api.cloudrf.com

[data]
dir = data
3. Process your data
Open a console in the ‘windows’ folder in the folder with the .exe files. Call the program followed by the CSV file and an output format eg. KMZ.
area.exe -i 3sites.csv -t drone.json
Or for the Path Profile API with PNG chart images…
path.exe -i link.csv -t drone.json
If your data is well formatted, you will see results appear in your terminal for each row. Any errors will report the offending line from the JSON which normally means a missing or misspelled column name in the CSV.
points.exe -i route.csv -t drone.json
Use your results
Everything you do is stored on the server. The demo script also pulls down a KMZ file for each calculation but if you want to see your finished result, login to the web interface at https://cloudrf.com/ui and open your archive. You will find your spreadsheet has become a coverage map! You can use the data either in the web interface, download it from there as a KMZ, SHP or TIFF file. If you want to publish or share the data you can get a URL or HTML embed code to host the layer on your own website.
Create a super layer
You can merge all your sites into one layer for convenience with the ‘mesh’ API.
Create a super layer by visiting this URL in any browser with your UID and network name. The layer can be named whatever you like but will belong to the ‘mesh’ network group within you archive. If you have lots of large sites this can take a minute a site so be patient and check your archive later.
https://api.cloudrf.com/mesh?uid={your UID}&network={your network}&name={superlayer}
Change and repeat
Once you’ve got your result its quite common to wonder what effect a different parameter might have. To change a value for all columns, change it for the first row eg. set txw (Transmitter power in Watts) to 2 then copy that value into all the rows below. Save the CSV file and reprocess with the command as before. You will need a new network name (net) to keep your new files separate. In your web archive you can then go and select the network with the old parameters and delete it by checking the box and clicking the trash can icon.Alternative languages / scripts
The simple API can be used with any other language. You can find examples of Javascript forms from the API clients downloaded in the example above and more languages over at https://api.cloudrf.com. Expert users don’t even need a desktop as you can use CURL from a shell environment:


