
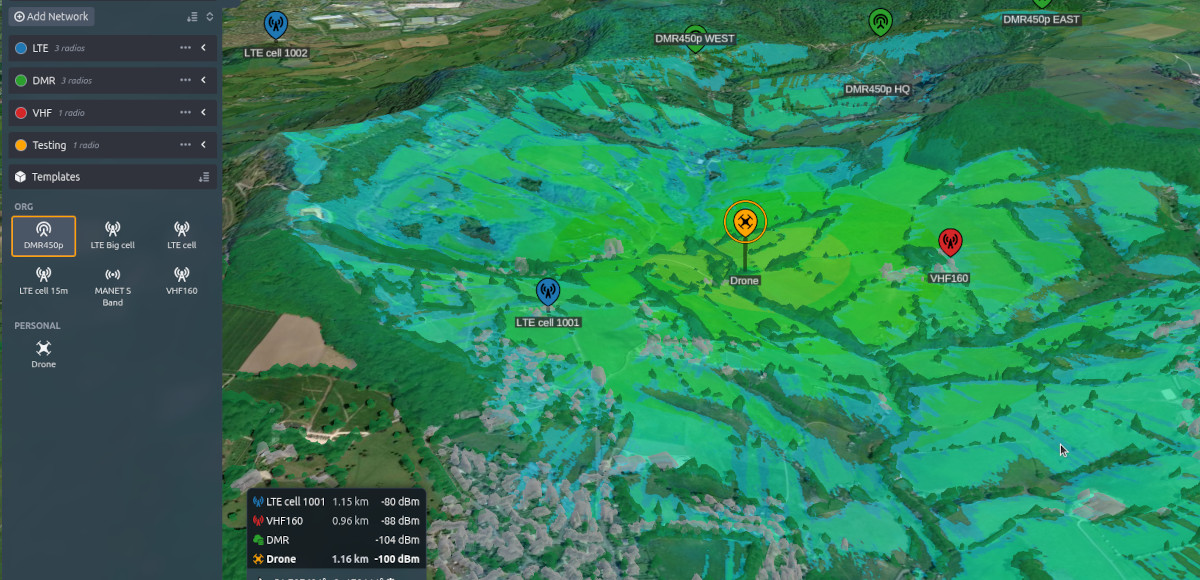
The Project and Network User Tool (PNUT) is the latest CloudRF interface, developed to meet growing demand for full spectrum planning.
Background
CloudRF’s innovative interfaces have evolved a lot in 14 years, driven by user feedback, with a focus on simplicity.
Our latest cross-platform interface required a significant amount of work on the back-end to facilitate enterprise features such as project management, roles and and future collaboration across technologies. This was in response to requests from organisations for data sharing and team access.
Our established web interface, developed 6 years ago with Cesium, has fallen behind new web technologies and is based upon site planning as opposed to networks. This is evident from its input form which only allowed one site at a time to be selected or edited by a single user. This was fine for building small private networks but had limitations for larger networks and teams.
We’ve taken the opportunity to use a fresh React stack with the latest CesiumJS release to support our ambitions to build a new interface to show off our powerful API.
New features
Project management
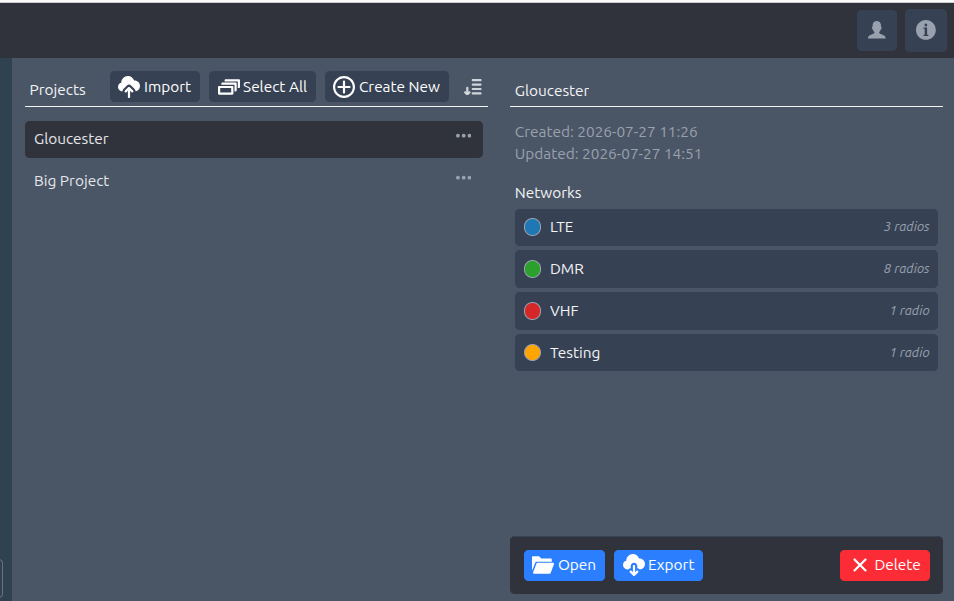
When a user logs in, they are presented with a project dialog to start , import or resume a project. The scope of a project is radio networks, templates and metadata which can be shared as a single text file. The file describes all the detail needed to rebuild the project in CloudRF or third party simulation software, without the weighty KMZ layers people previously traded in.
When a project file is imported, the layers are re-created on demand. This will use more API calls which is why this feature is enabled for premium plans only.
Network centric design
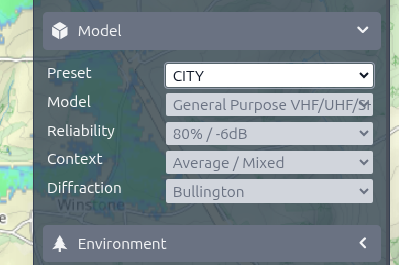
The interface was been rearranged to focus onto networks versus sites. The left panel is for networks and templates and the right panel contains familiar site settings (radio, antenna, environment, model etc).
To safe repeating actions, settings can be defined at the network level. For example, all the sites in a network may have common receiver, environmental and model configurations but varying heights and transmit powers.
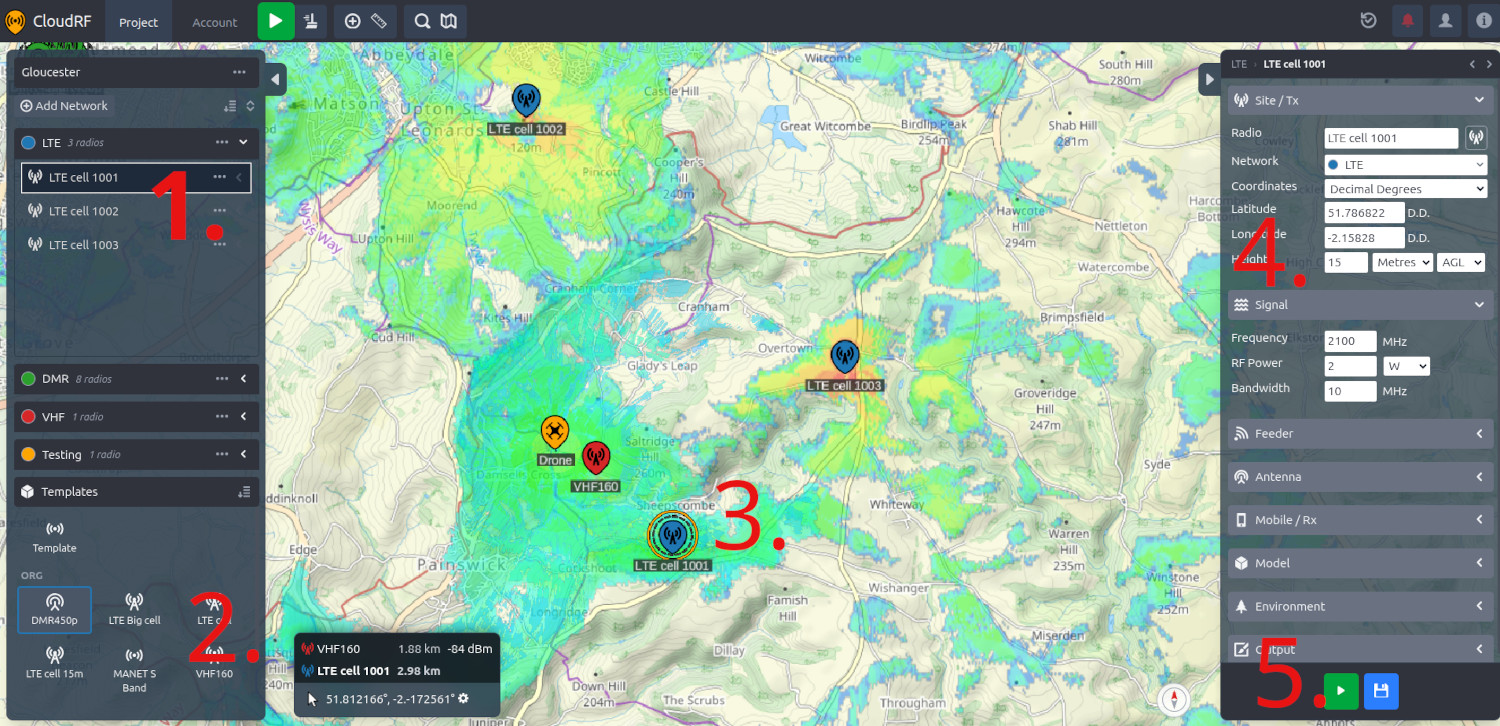
Using the screenshot above, the key sections, used in a typical design sequence are:
- Network panel. For defining a network
- Templates panel. For rapidly adding a template
- Map showing selected site. Colour coded networks easy management.
- Site settings. These are familiar to anyone who has used our legacy web interface.
- Calculate and save buttons. Also familiar. These will model coverage or save all the settings as a new template for quick access.
Project presets
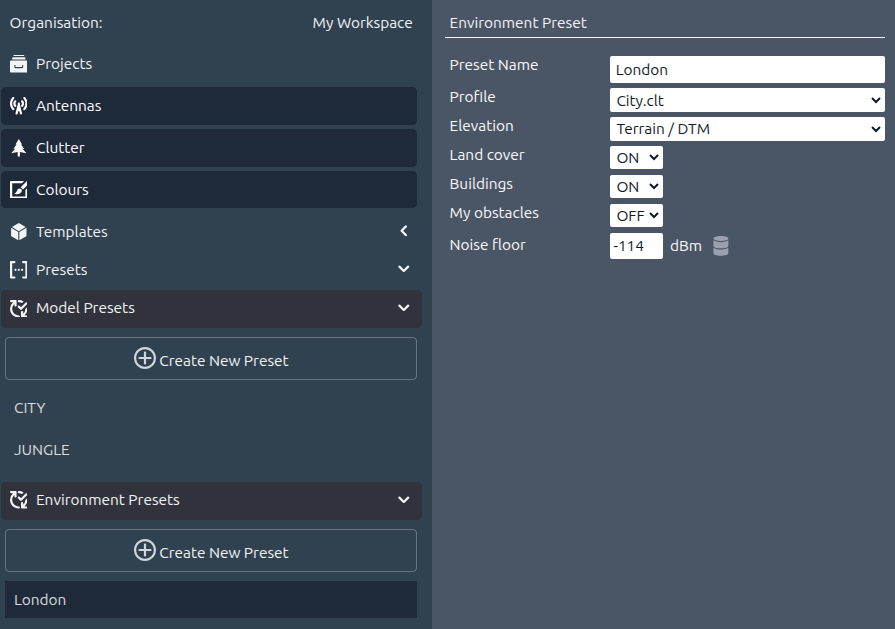
We’ve spear headed open standard templates for site settings for years to reduce error, save time and speed up planning. We’ve now gone one further and extended those templates across projects so users can define global presets for the benefit of the entire team. Now expertise can be scaled.
This means a super user can define quality settings for radios and environments which junior users can benefit from. Presently the workflow is optional but when we add more roles in the future, it can be enforced to prevent users making poor choices or straying into parameters they shouldn’t change.
Map settings
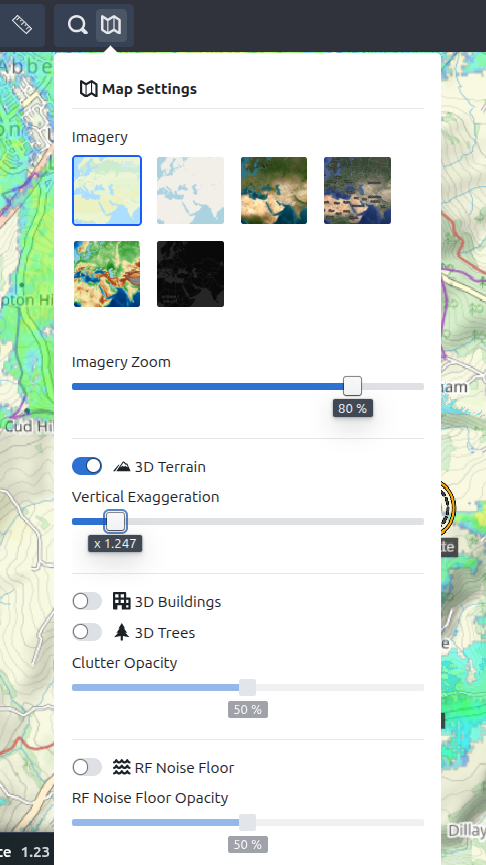
All map layers and settings have been moved to a new dialog linked from the header.
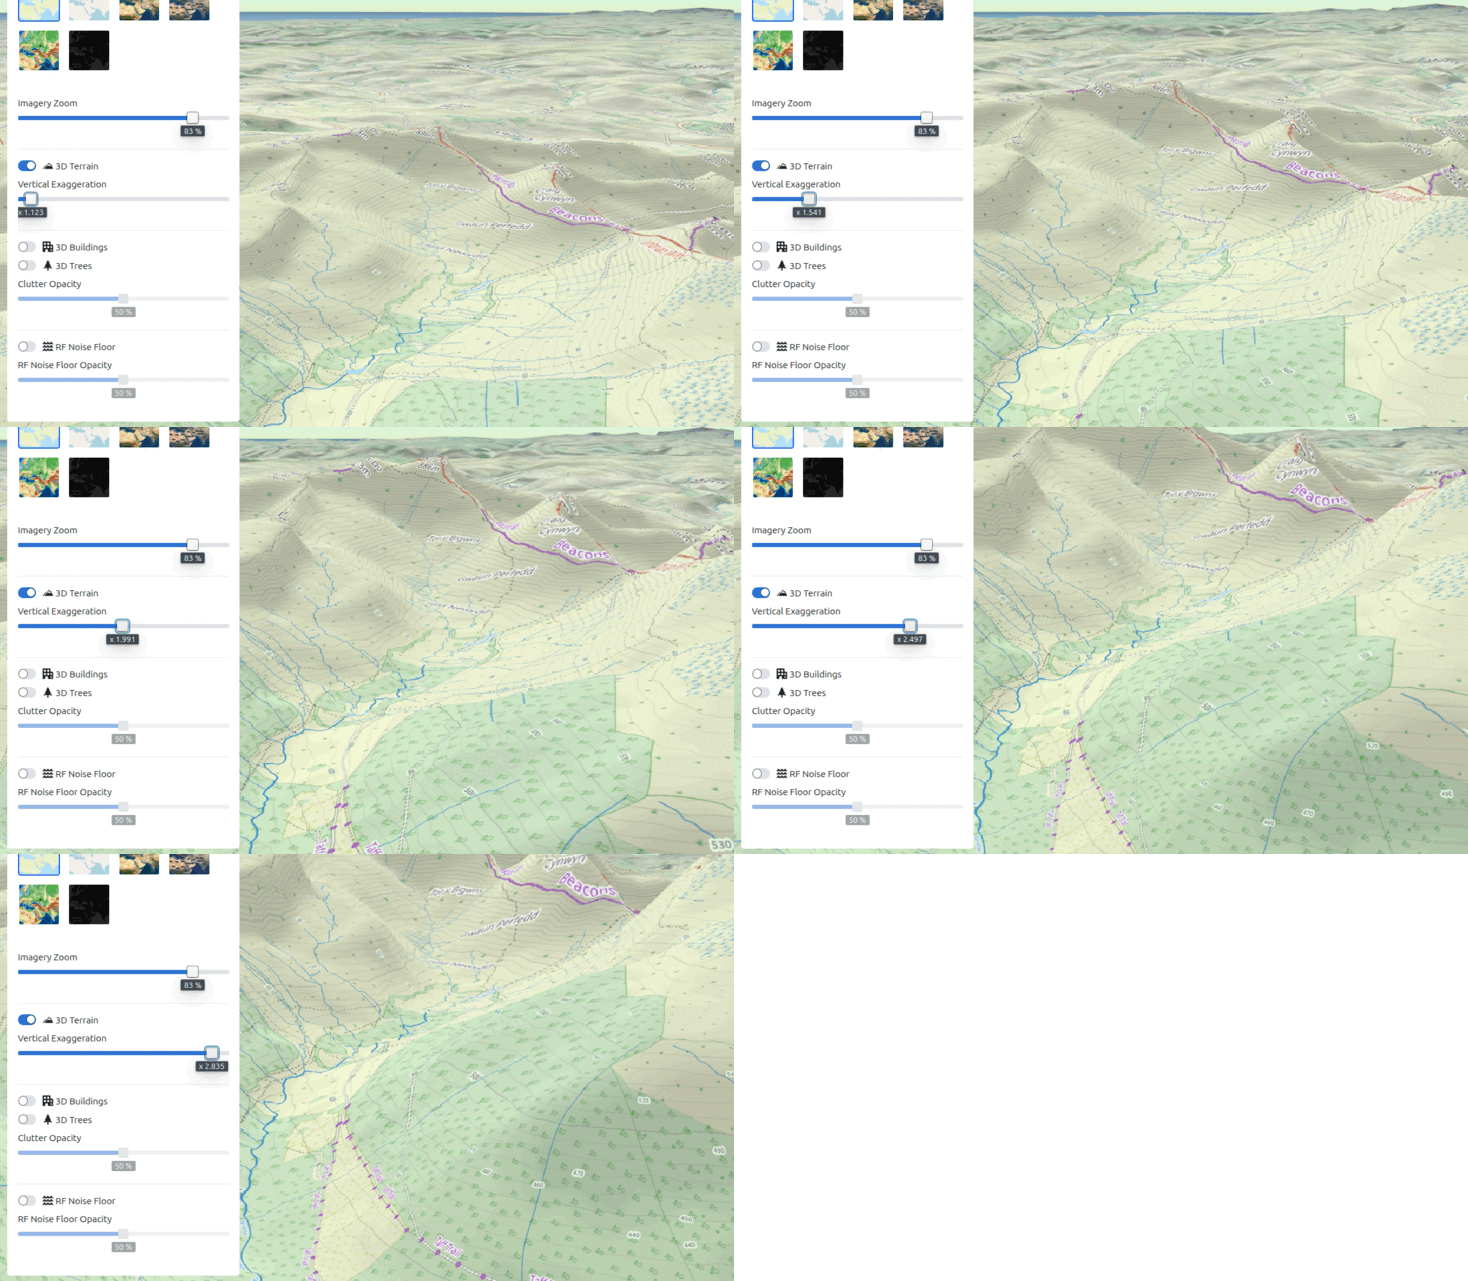
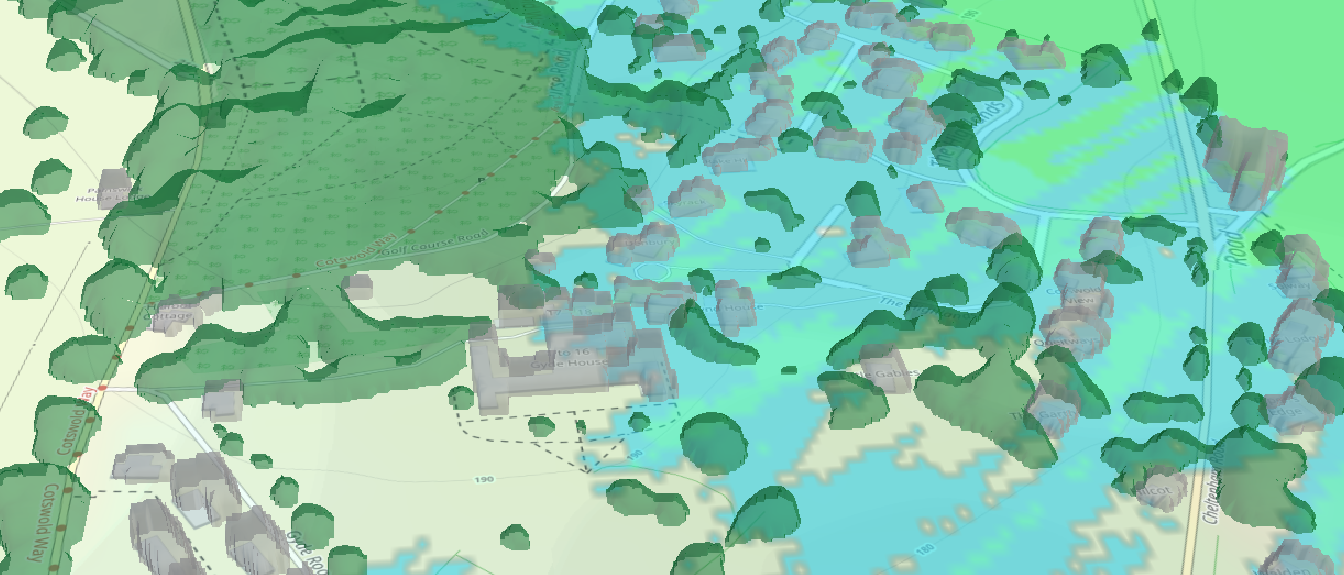
We’ve implemented some exciting features here to exploit our new 3D Tiles endpoint such as vertical exaggeration and streaming clutter built from our own data instead of third party sources.
The new 3D Tiles endpoint is a significant back end feature which might not appear significant on the web in 2026 where AI developed 3D globes are everywhere but will be noticed when this ships with our offline product, SOOTHSAYER.
The next release of SOOTHSAYER will be one of the few offline web native maps capable of rendering 3D terrain and clutter without a GIS server.
Noise has been added as a core layer into our map layers and is visible when the database contains data and the ‘Database’ option is enabled for a selected network.
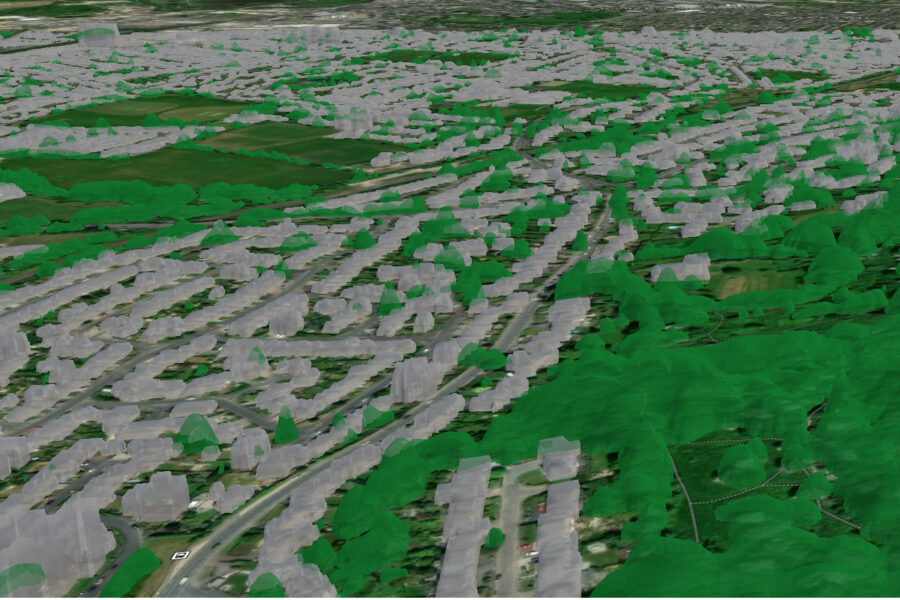
WYSIWYG clutter
What-You-See-Is-What-You-Get (WYSIWYG) is a common term used for web software whereby a GUI editor translates buttons to code so when you click Bold, you get bold HTML tags. Our new clutter implementation addresses a long standing issue with our legacy web interface whereby the buildings and trees visible on the map don’t always match what we hold on the API.
Now they match as the data in the web interface is generated from the data on the API. If we hold data, we make 3D terrain, tree canopy and buildings. If we don’t you will just see a map when these layers are enabled. This uses an advanced backend pipeline to create and cache this volumetric data.
SOOTHSAYER users can add their own data into the backend so if they add a high resolution raster for an open pit mine, they will see the mine in high resolution in their web interface and API output.
Full spectrum analysis
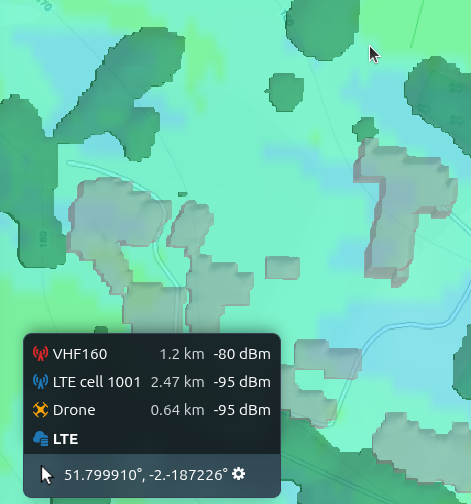
Our previous signal-strength-tooltip required a user to work with a defined network or layer.
We’ve evolved that concept to make it network agnostic so if you have multiple overlapping technologies such as LTE, DMR and VHF you can sample coverage of all the layers at a single position. The layers don’t need to be visible as visibility is configurable at the network layer.
In Emergency planning this is especially applicable to PACE planning (Primary, Alternate, Contingency, Emergency) methodology whereby multiple technologies will be implemented in a plan.
When noise is active, the interface will also report noise under the cursor and the local SNR for a selected network.
Template sandbox
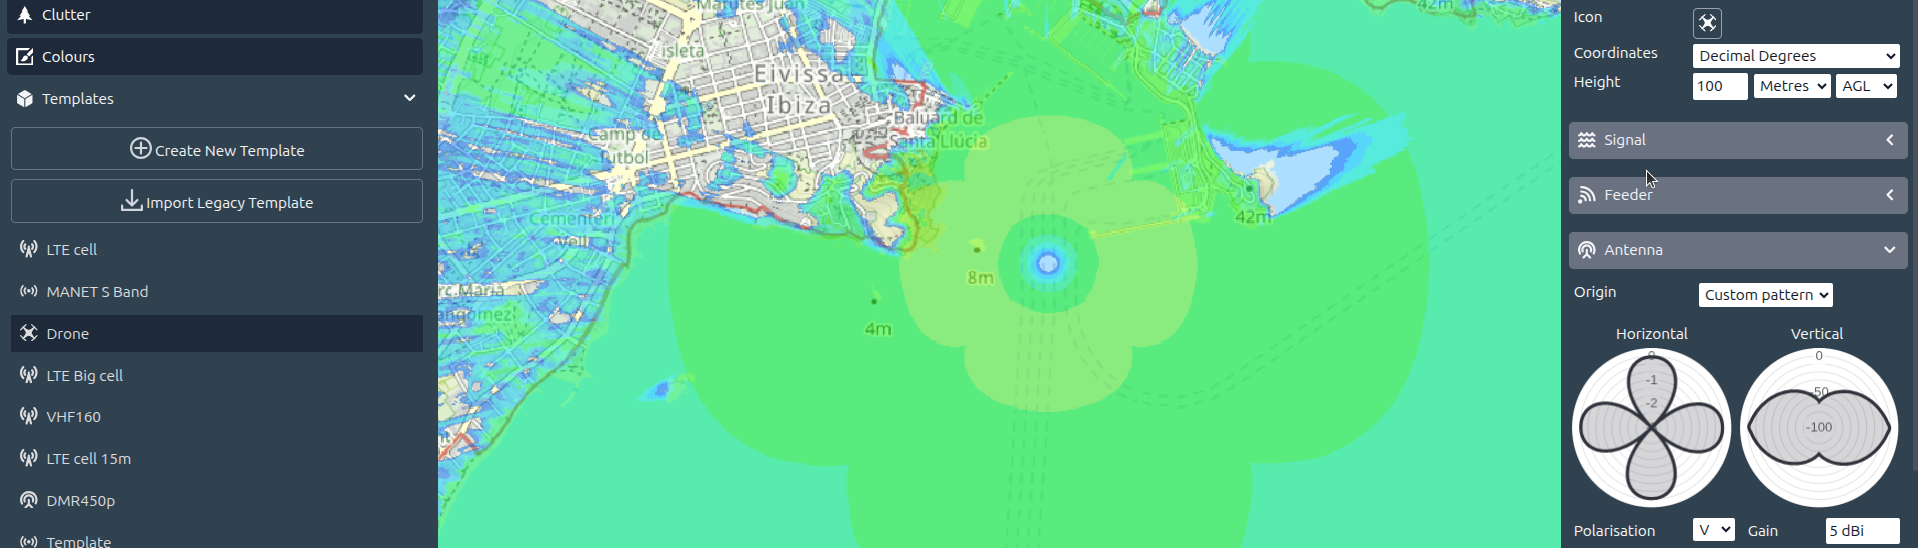
Our popular templates system has had an uplift so you can now define template groups and icons and rapidly iterate models by duplicating templates to change a setting for example.
We’ve introduced a template sandbox on an island so you can get the settings right without touching your project.
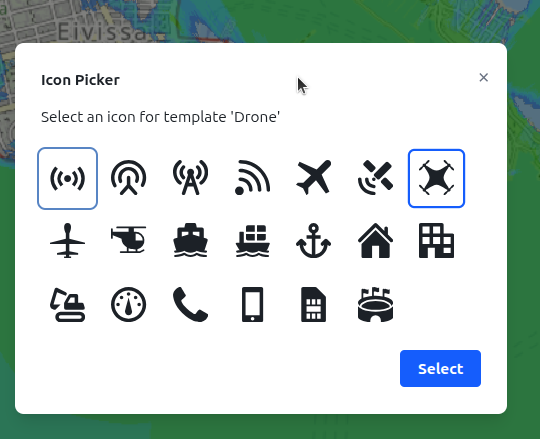
Icons can now be defined from a shortlist.
We’re open to suggestions to expand this but for now there’s enough to define most technology.
Peanut??
The abbreviation PNUT is short for Peanut, a young company dog with incredible agility.
We appreciate this isn’t the most serious product name in the history of telecommunications planning but then we’re a small company who are disrupting a market of 30 year old tools designed to win bids by listing ITU models, not to be used when and where it matters.
We’re happy to be discounted by legacy firms and opinion-for-hire analysts for having a human side. 🥜
Roadmap
The first release is the structure with basic tools (Area / Path). The next release will add more tools to bring it up to spec with the legacy web interface and the third release will bring in the phase tracing 3D interface so we can absorb two projects into one interface capable of planning outdoor and indoor.
2026 Q3 – v1
- Project management
- 3D Tiles (Buildings, Trees)
- Offline 3D Terrain from API DTM
- Multi network management
- Template manager
- Implements Area, Path, Multisite, Multilink APIs
2026 Q4 – v1.1
- Organisation management (Users can join a team)
- Data managers: Clutter, Colour keys
- Best Site Analysis
- Interference Analysis
- Route Analysis (whole network)
- Satellite tools
- Data import (Drive survey, Coverage analysis etc)