How Can We Help?
RF planning 101
Accurate radio coverage planning requires a large number of variables.
Typically these will include specifying parameters for the transmitter, feeder (cabling), antenna and environment at both ends of a link.
The accuracy of the output is directly proportional to the accuracy of the inputs and the time spent defining them. If you rush your research to achieve a ‘quick’ result it will likely come at the cost of accuracy! Take your time with researching your true values before processing them through the system.
There are more variables than hours in a day so focus on the important physical parameters eg. Power, cabling instead of logical parameters such as internal channel parameters specific to a protocol like LTE. Ask yourself the following questions when considering a new system or link:
Transmitter
What is your transmitter’s RF power output in Watts or dBm? A WiFi router in Europe has a power output of 0.1W / 20dBm
What is your transmitter’s frequency? If it’s frequency-agile then pick the middle frequency eg. 2450MHz
Where is it located? Location is key but is an easier variable to understand and factor in using simplistic viewshed analysis available in most maps like Google Earth.
Bandwidth should be considered also. There’s a reason why a LoRa 2.4G signal can be detected much further than an equivalent 802.11b/g/n signal despite them both using the same frequency (2.4GHz) and power (20dBm) and that’s because LoRa is a narrow-band signal. As bandwidth increases so does channel noise which impacts the signal-to-noise ratio and effective range.
This principle is known as Shannon Hartley theorem. In CloudRF, the receive threshold is adjusted on the server as bandwidth increases so a wide-band signal won’t “go as far” as a narrow one. The default bandwidth is 100KHz which negates any compensation.
Feeder
A huge amount of RF power is lost through cabling and connectors, especially at higher +UHF frequencies (>300MHz). You could easily lose more than 50% of your radio’s potential power output by introducing cabling between the radio and antenna. If the thickness of the cabling is badly matched to the system you could even create such a resistance that nothing except heat is radiated. For this reason, many modern outdoor WiFi radios are elevated ‘up the pole’ without cabling to maximise efficiency. Domestic TV feeders are normally very long and inefficient but they are fed by a high gain rooftop yagi. If they were fed by a low gain antenna the cable loss would stop the UHF signal reaching your TV unless you lived in the shadow of a transmitter.
Is your antenna connected directly to the radio or remotely via a length of co-axial cable?
If you are using RF co-axial cable you need to find out what type. It will make a big difference.
How long is the co-axial cable? How many connectors? What grade is it eg. RG-58?
Antenna
The antenna you connect to your radio will make a huge difference. Understanding antenna gain and how it is measured is important for best coverage.
A basic monopole antenna will have a gain of between 0 and 3dBi – varying by frequency as an antenna has a bias towards a resonant frequency.
The units for antenna gain are decibel-isotropic (dBi) and decibel-dipole (dBd) referenced to a theoretical spherical pattern and a donut shaped dipole pattern respectively. You will find dBi is the most common as it is (2.15dB) greater than dBd so looks better in product marketing.
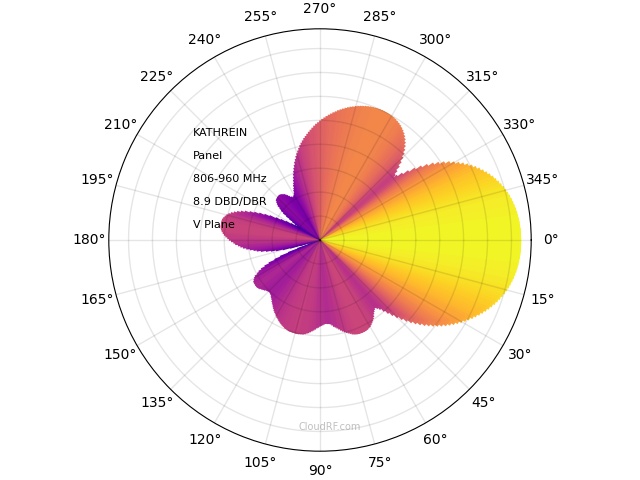
A mobile phone antenna has a variable gain of between -1 and 1dBi typically whereas the panels on the mobile phone tower may be anywhere from 4 to 19dBi. This is why a phone can work such long range with only a fraction of a watt of RF power and a simple antenna. The link gain is in the elevated high gain directional panel antenna on the tower.
The polarisation of the antenna is considered for some propagation models like ITM. For best results the polarisation should match at the transmitter and receiver. A mismatch will lose several dB of power.
For directional antennas the azimuth (heading) and down-tilt must be considered. In CloudRF tilt is inverted measured from the horizon so a positive down-tilt would be looking downhill and vice-versa.
Receiver
The receiver parameters are as important as the transmitter and should not be brushed over.
Receiver height is important. Too high and you will produce an overly optimistic output.
Receiver gain could be from 0dBi for a mobile phone or 19dBi for a parabolic ‘long range WiFi’ dish. Ensure you set the correct value from your manufacturer’s datasheet. If you are unsure use 1dBi for a conservative measurement.
The measured units can be Path Loss (dB), Received Power (dBm), Field strength (dBuV/m) or Signal-to-noise ratio (dB). Each mode has its own purpose and if in doubt you should use received power as this is the most common unit in modern low power communications systems.
The sensitivity is the threshold at which a receiver can effectively receive a signal, determined by many factors. This is normally written into manufacturer’s datasheets as a dBm value. For a mobile phone this will be in the range -101 to -110dBm.
The noise floor varies by environment and band but will typically be between -110 and -120dBm. Assuming a need for a 20dB SNR for to decode a digital signal this gives a threshold of -90 to -100dBm. The threshold varies by modulation, for example QPSK only needs 4dB SNR so could have a threshold of -116dBm for a narrow-band digital modem.
For Wi-Fi planning use -90dBm.
Model
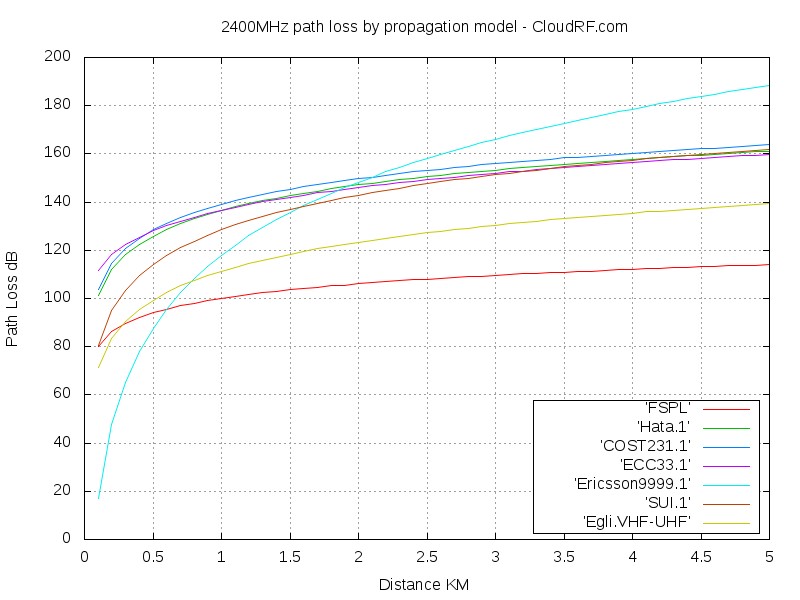
Picking a propagation model can be daunting. Different models exist for different purposes. Two general purpose models you should know are the ITU-R P.525 free space model and the ITM Longley-Rice model. They will produce VERY different results with the same settings so its worthwhile understanding why.
The free-space model is frequency agnostic and represents a best-case scenario without additional losses. It’s advantage is that will work with any frequency and give you accurate output providing you budget for the losses as well. Without losses it will report results 10,20 even 30dB higher than real-world results. As a minimum you should be adding in a fade margin of 10dB plus a receiver loss of 3dB. You can make this adjustment in the transmitter and/or receiver gain fields.
The ITM model is focused on UHF broadcasting so if your signal is below <3GHz you may find it delivers accurate results. It will generally produce a result at least 10dB lower than the free space model but with better sensitivity to terrain and multi-path effects from complex terrain like diffraction. The ITM model can normally be used without a fade margin or receiver loss providing antenna gains have been properly budgeted.
You can see model curves for different frequencies here. If unsure pick a conservative model or one in the middle of the range.
Clutter
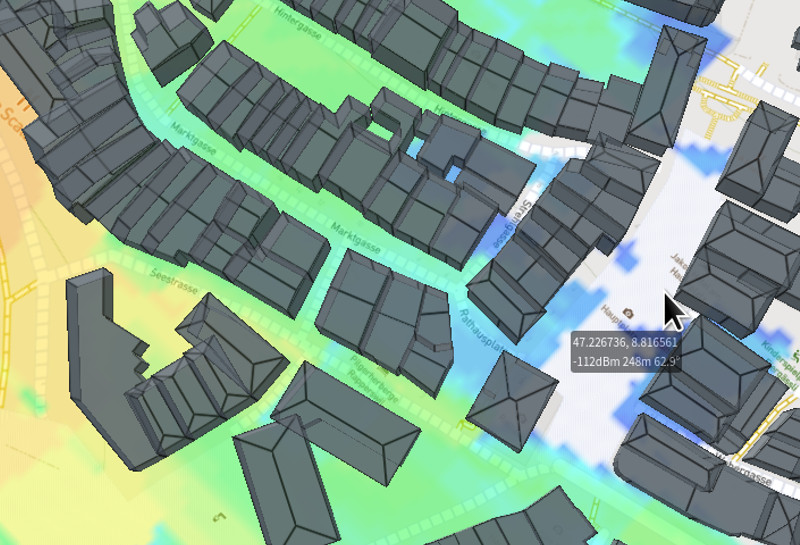
Clutter refers to above ground obstacles including buildings and trees. You should consider clutter if its available for maximum accuracy otherwise you will generate an unrealistic outcome. Buildings attenuate RF signals substantially and the effect increases with frequency so a 5.8GHz signal will struggle to penetrate a solid concrete wall whereas a 99MHz FM radio signal will breeze through it.
You can enable LiDAR clutter in some regions which is high resolution building data where buildings are represented as the earth eg. solid.
For many regions you can now also enable 3D buildings which are different to LiDAR in that they are permeable and configurable so you can request brick houses or wooden houses for example.
Resolution
Everyone wants the highest resolution possible but this isn’t possible or practical at some distances as you could easily request to generate an image several hundred megapixels in size which would fail to render in any application. Each pixel in an output image represents n metres on the ground so requesting 2m resolution for 50km radius would create a 10,000 x 10,000 image or 100 Megapixels – which would take a long time to create as well.
A range of resolutions from 2m to 100m are offered which are combined with the radius to compute a capped resolution under 30MP which will be both fast to create and consumable in different image and mapping applications.
If you are unsure of data in your country use 30m as this is the baseline resolution of data in the system. Countries with LiDAR like the UK, Estonia and US and EU cities have 2 or 5m resolution data.
For radius, of you are unsure, request a smaller radius eg. 10km and increment it gradually before attempting a large calculation like 100km. It will be faster if you need to make changes to your settings and may well reveal that you can not reach over the (20-40km) horizon to 100km anyway.
Path profile normalisation
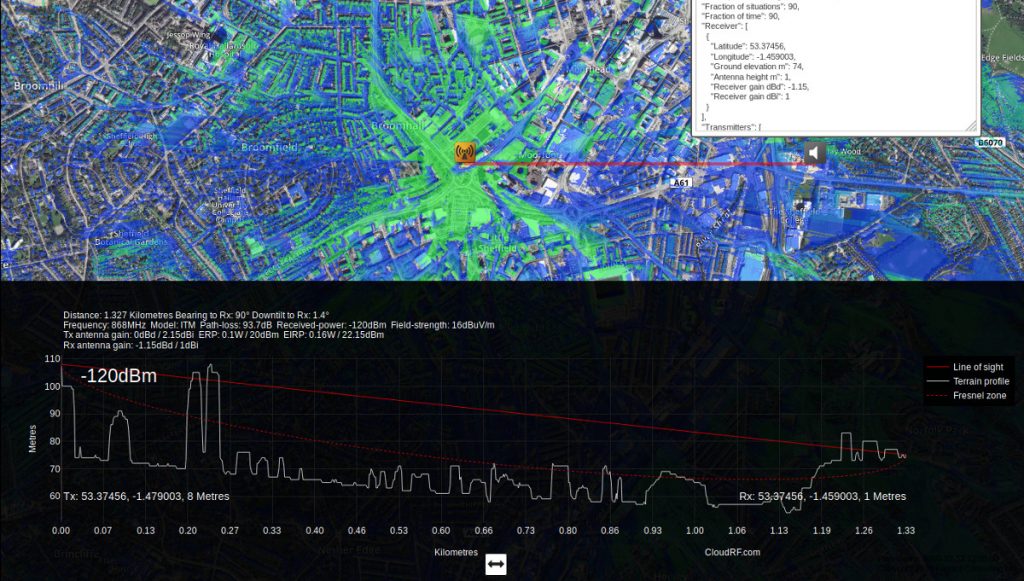
A regular query with the path profile chart is regarding a phenomenon called normalisation.
This warping of heights is deliberately applied to represent a dynamic terrain profile in a fixed rectangle. It occurs with earth curvature where a central “hill” may appear over a long water link for example and also links with height differences between transmitter and receiver.
The solution for absolute height values is to use the AMSL (Above Mean Sea Level) heights which are returned in the API response as an array called “Terrain_AMSL”. For more information see here: https://cloudrf.com/documentation/developer/#/Create/path
Path normalisation does not affect signal values, it is for terrain presentation only.


