


Web Interface RF Tools
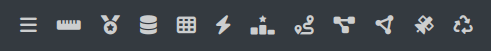
Function Menu Overview
 Expand/Collapse Side Menu
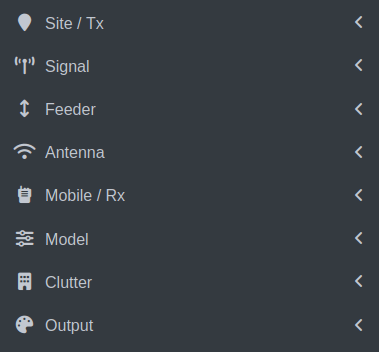
The Expand/Collapse button lets you expand or collapse the Side Menu consisting of Templates, Input Menu and Output Console.
To Collapse the side menu:
Click on the Expand/Collapse
button.The Side Menu will collapse.
When you mouse-over upon the Side Menu, the expanded view of the menu will appear.
To Expand the side menu:
Click on the Expand/Collapse
button.The Side Menu will expand.
 Path Profile Tool
The Path Profile Analysis tool lets you inspect the terrain profile between two positions - Transmitter and Receiver.
Point-to-Point Path Profile Analysis (Tx to Rx)
For Point-to-point path profile analysis (Tx to Rx), you can set the Transmitter and Receiver location either by Visual Map Placement or Precise Location Entry method.
Visual Map Placement
You can click on the Map to site your Transmitter and Receiver location visually:
Site your Transmitter location on the map.
Click on the Path Profile Tool
button on the Function Menu.Click on the map to site your Receiver location.
Precise Location Entry
To use GPS co-ordinates, you can configure the Transmitter and Receiver location manually:
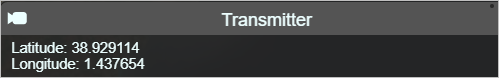
Configure your Transmitter location (Latitude and Longitude) in the Site/Tx Input Menu.
Click on the Path Profile Tool
button on the Function Menu.Configure your Receiver location in the Mobile/Rx Input Menu.
Click on Run
 button.
The Black Result Box
After setting your Transmitter and Receiver location, the Black Result Box will appear.
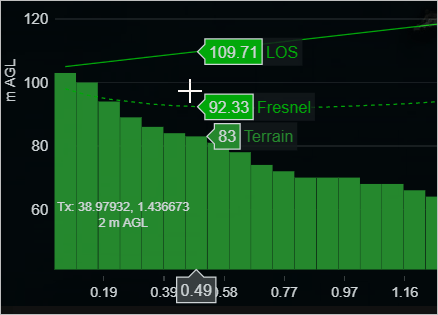
The Path Profile in the form of a graph consisting of the path profile components - Terrain, Fresnel and LOS will be displayed.
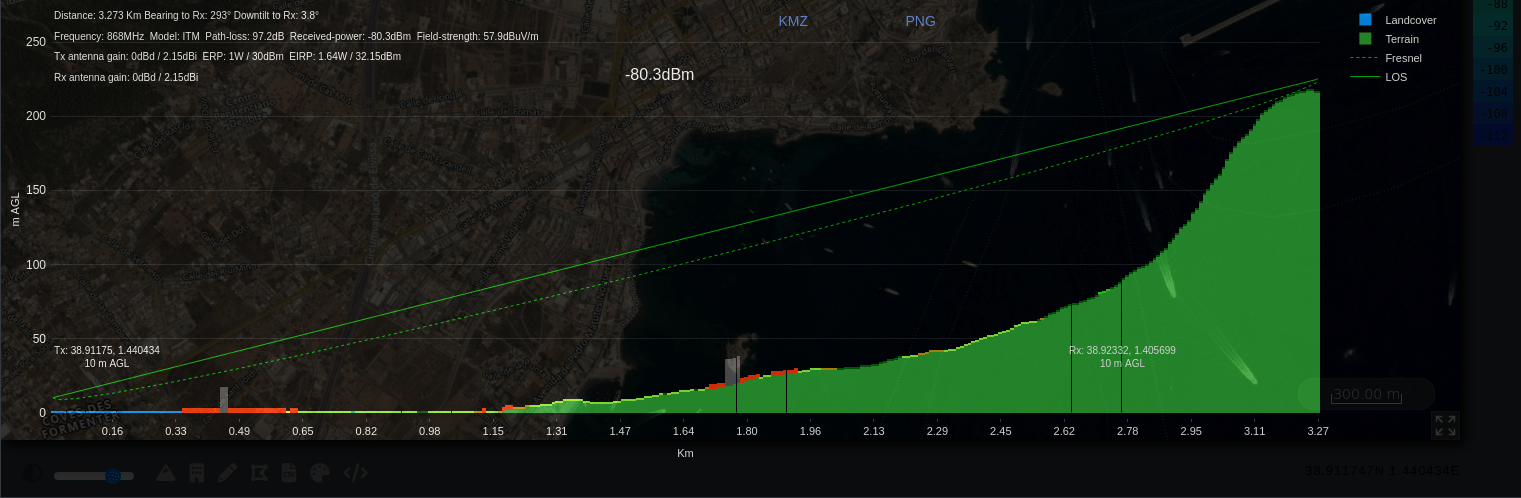
The Transmitter and Receiver related information (Distance, Frequency, Model, Path Loss, Received Power, Field Strength, Tx Antenna Gain, ERP, EIRP, Rx Antenna Gain) will also be displayed along with the graph.
You can click on the Download.PNG link to download the Path Profile graph image.
Various Function Icons will be available as you mouse-over on the Result Box.
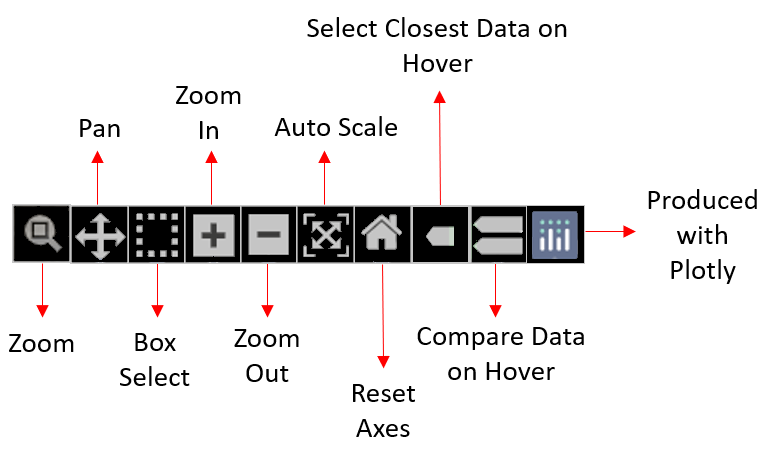
Zoom - lets you zoom the desired section of the Path Profile Graph.
Click on the desired section’s starting point and without releasing the mouse, select the section.
Pan - lets you pan view the graph interactively.
On selecting the Pan function icon, the pan mode for axes gets turned on in both
xandydirections.Click on the graph and without releasing your mouse, move in the direction you wish to pan view the Path Profile.
Box Select - lets you select a particular section of the graph that you wish to view.
The selected box section will be highlighted from the rest of the path profile graph for clear view.
Zoom In - lets you zoom in the Path Profile Graph.
Zoom Out - lets you zoom out the Path Profile Graph.
Auto Scale - lets you auto scale the axes of the graph.
Reset Axes - resets the axes as per the original graph.
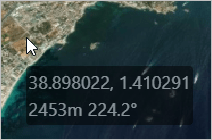
Show Closest Data on Hover - shows you the closest data from the point on the graph where you hover.
The closest path coordinate will be displayed as below:
Compare Data on Hover - shows you the comparison of the data from the point on the graph where you hover.
The graph comparison will be displayed as below:
Produced with Plotly - redirects you to the Plotly website.
To Change the Resolution
Click on Output Input Menu.
In the Resolution field, select the resolution that you wish to set from the drop-down.
To Change the Building / Clutter Attenuation
Click on Clutter Input Menu.
In the Clutter Mode field, select Soft/NLOS as the option from the drop-down.
In the Min attenuation field, select the Clutter attenuation that you wish to set from the drop-down.
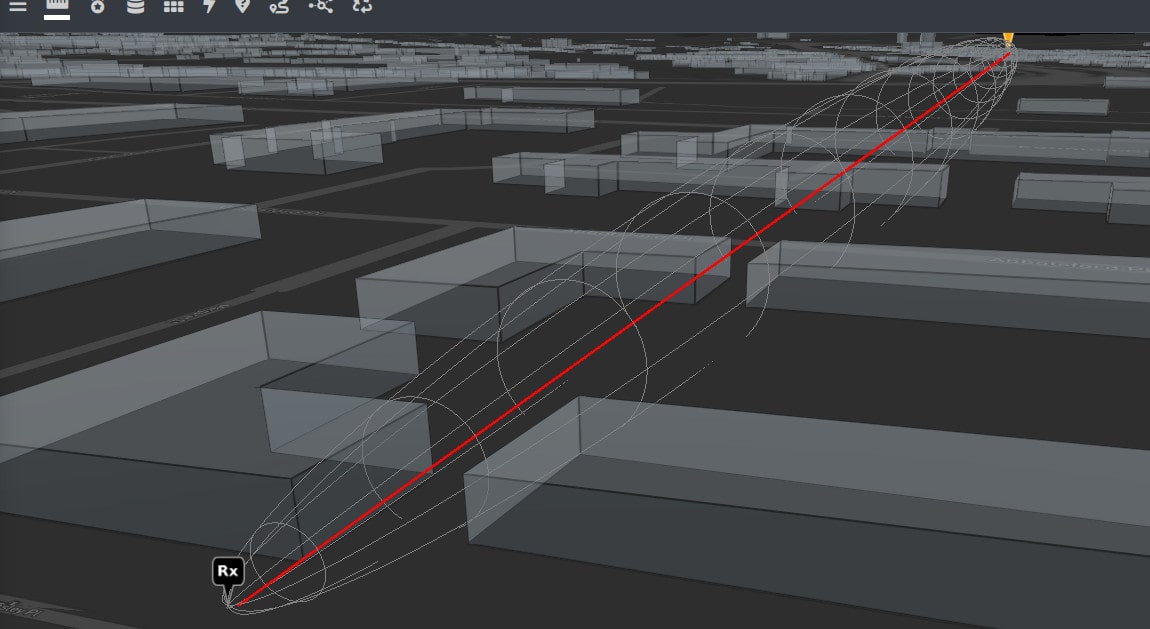
Fresnel zone
Around each link will be a 3D ellipsoid showing the estimated fresnel zone. This cone of power has a direct relationship with frequency/wavelength so a VHF signal has a huge fresnel zone and a SHF signal has a small focused one, like a laser. An ideal link would have an unobstructed fresnel zone otherwise you will be losing power. A viable microwave link needs at least 60% of its fresnel zone to be clear of obstructions. If you are modelling over the sea and a link is near the water you should budget for tides also as these can be more than 10m and will disrupt a marginal link.
 Best Server Tool
The Best Server Tool is useful for checking coverage against an established network. A typical use case for this would be a Wireless Internet Service Provider (WISP) who want to check ZIP codes or properties for coverage.
To use the Best Server Tool:
Click on the Best Server Tool
button on the Function Menu.The Best Server Tool dialog box will appear.
Site your Transmitter location on the map.
Select a network to test coverage at the set transmitter location from the drop-down.
Click on Check Coverage button.
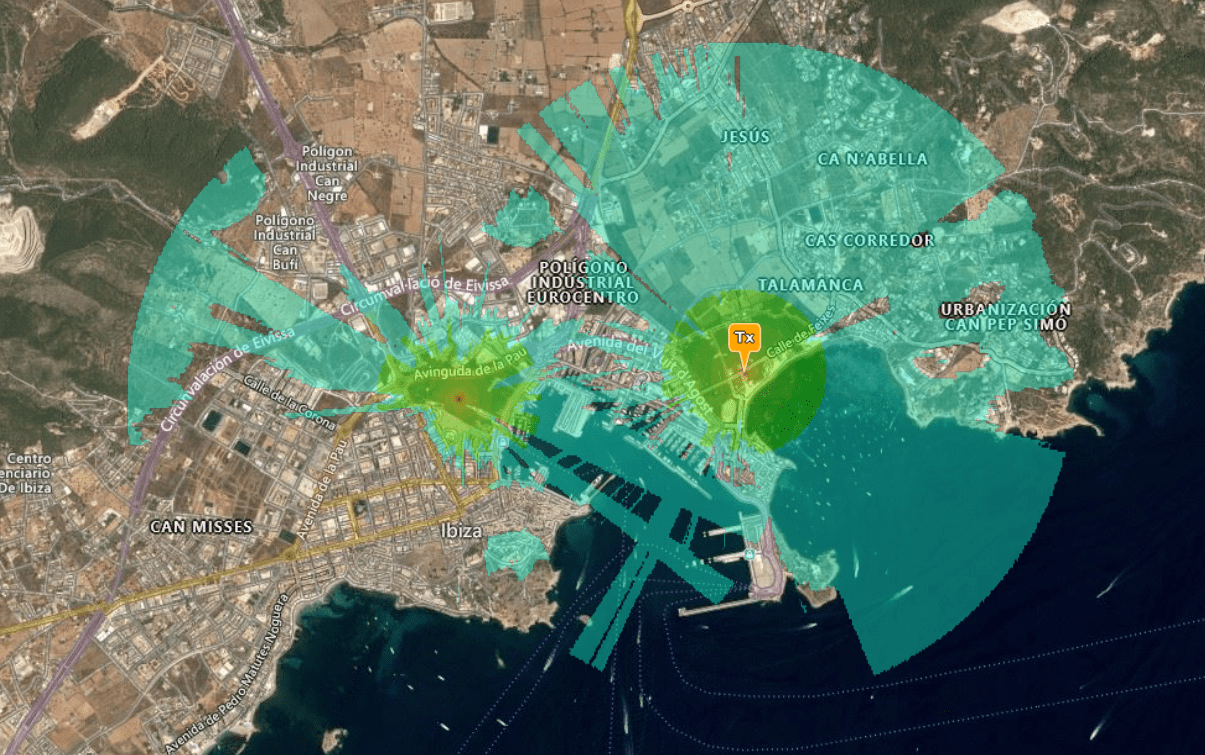
The Network Coverage as per your transmitter location will be reflected on the map.
You can change your transmitter location on the map to check the best server location and the network coverage.
 My Archive
My Archive lets you view the list of your saved networks and their details. It’s also where you can download data in open GIS formats like KML, KMZ, SHP, GeoTIFF and HTML.
Click on My Archive
button on the Function Menu.The My Archive dialog box will appear.
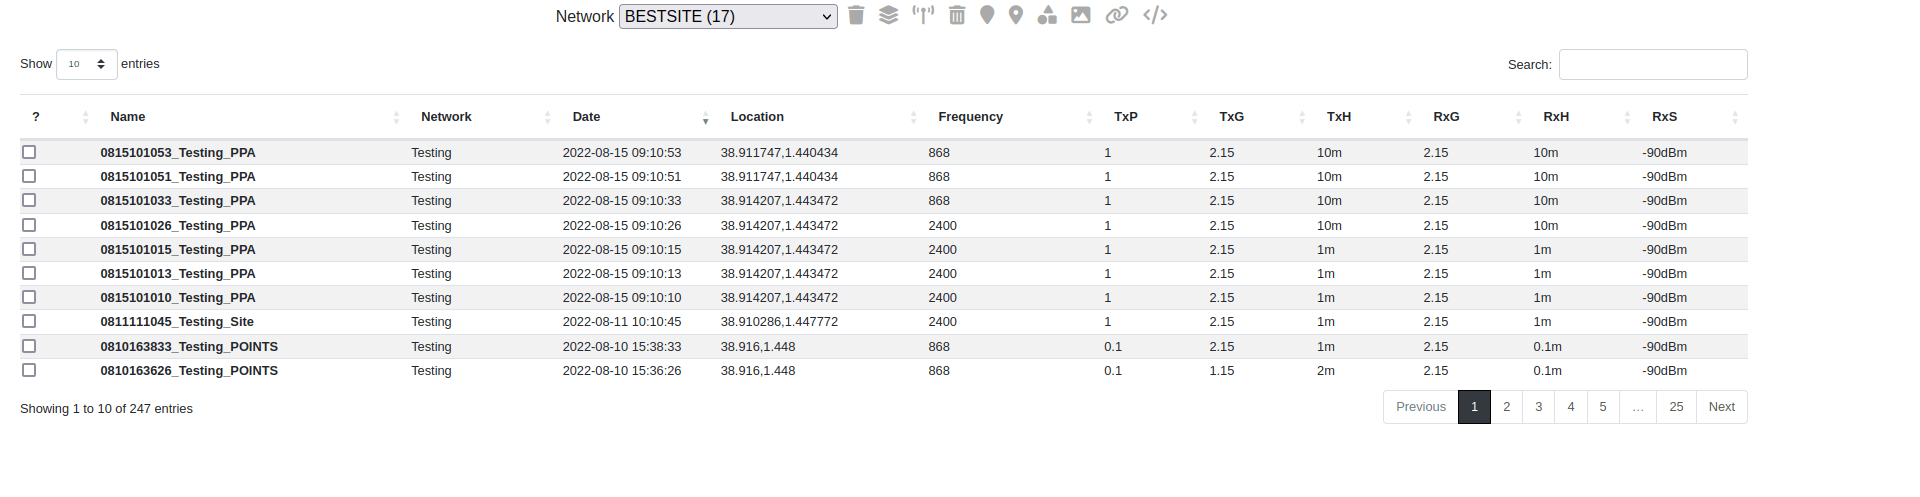
Searching and filtering by network
You can select and filter the Network(s) to reduce the entries in your table. This allows you to quickly recover a project or find MESH or MANET networks which are tagged with these network names.
Select the desired Network from the drop-down.
The list of networks will be displayed.
Select a network to filter results to those tagged sites only
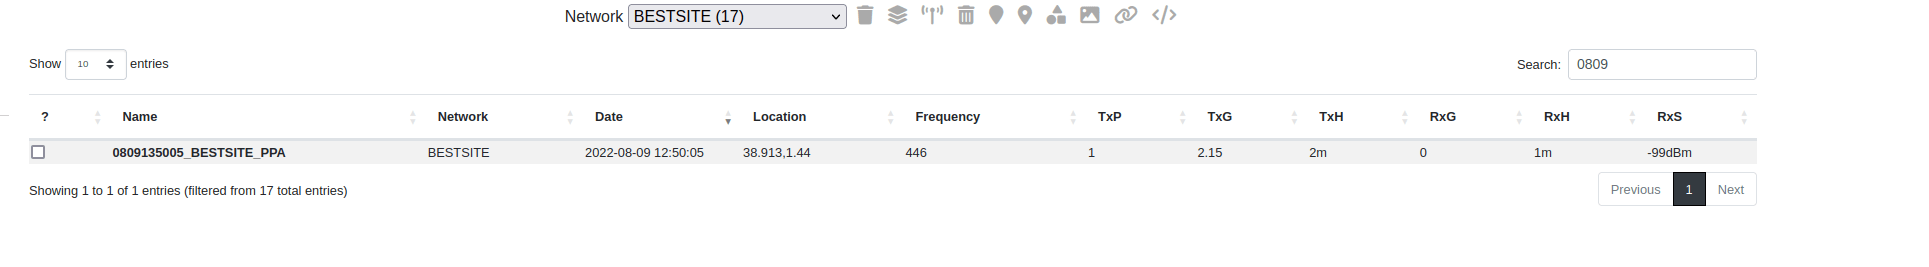
You can then find a specific site(s) with the Search box on the right side
The filtered entries will be displayed.
Sorting
You can sort the Network entries in ascending or descending order as per your requirement.
To do so:
Click on the Sort
 icon of the respective column.
The sorted entries will be displayed in the table.
indicates Sorting in the Ascending Order.
indicates Sorting in the Descending Order.
Various Function Icons are also available.
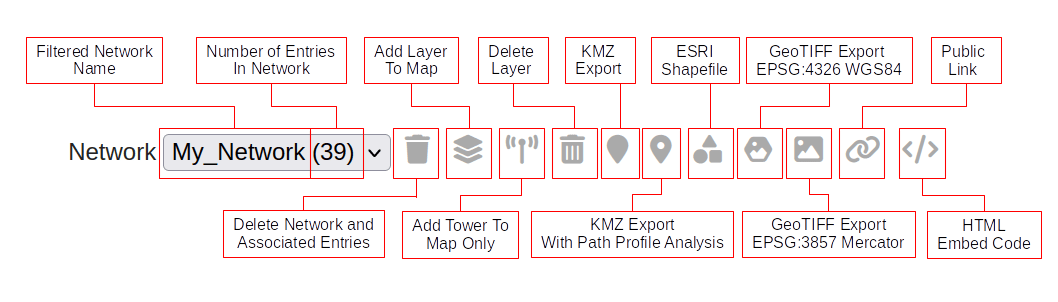
Add Coverage Layer(s) to Map - lets you add the selected network(s) coverage layer(s) to the map.
You can manage (select/deselect) the network site locations by clicking on the respective layer checkbox.
Add Tower(s) only to Map - lets you add the tower(s) to the map in the selected network(s).
Delete Selected - lets you delete the selected Network(s).
When you click on the Delete Selected button, the following warning dialog box will appear.
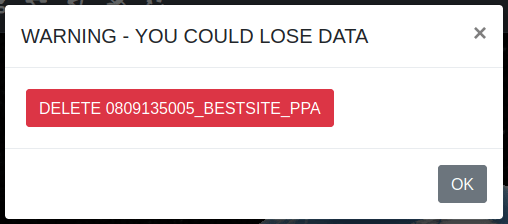
Click on OK button to confirm.
KMZ with Local Content - lets you download the KMZ file with the local content.
KML with Remote Content - lets you download the KML file with the remote content.
KMZ with Path Profile Analysis - lets you download the KMZ file with a embedded Path Profile Analysis utility (Internet connection required).
ESRI Shapefile - lets you download the Coverage zip file consisting of the DBH, PRJ, SHP, SHX files of the selected network(s).
GeoTIFF Image - lets you download the GeoTIFF image of the selected network(s).
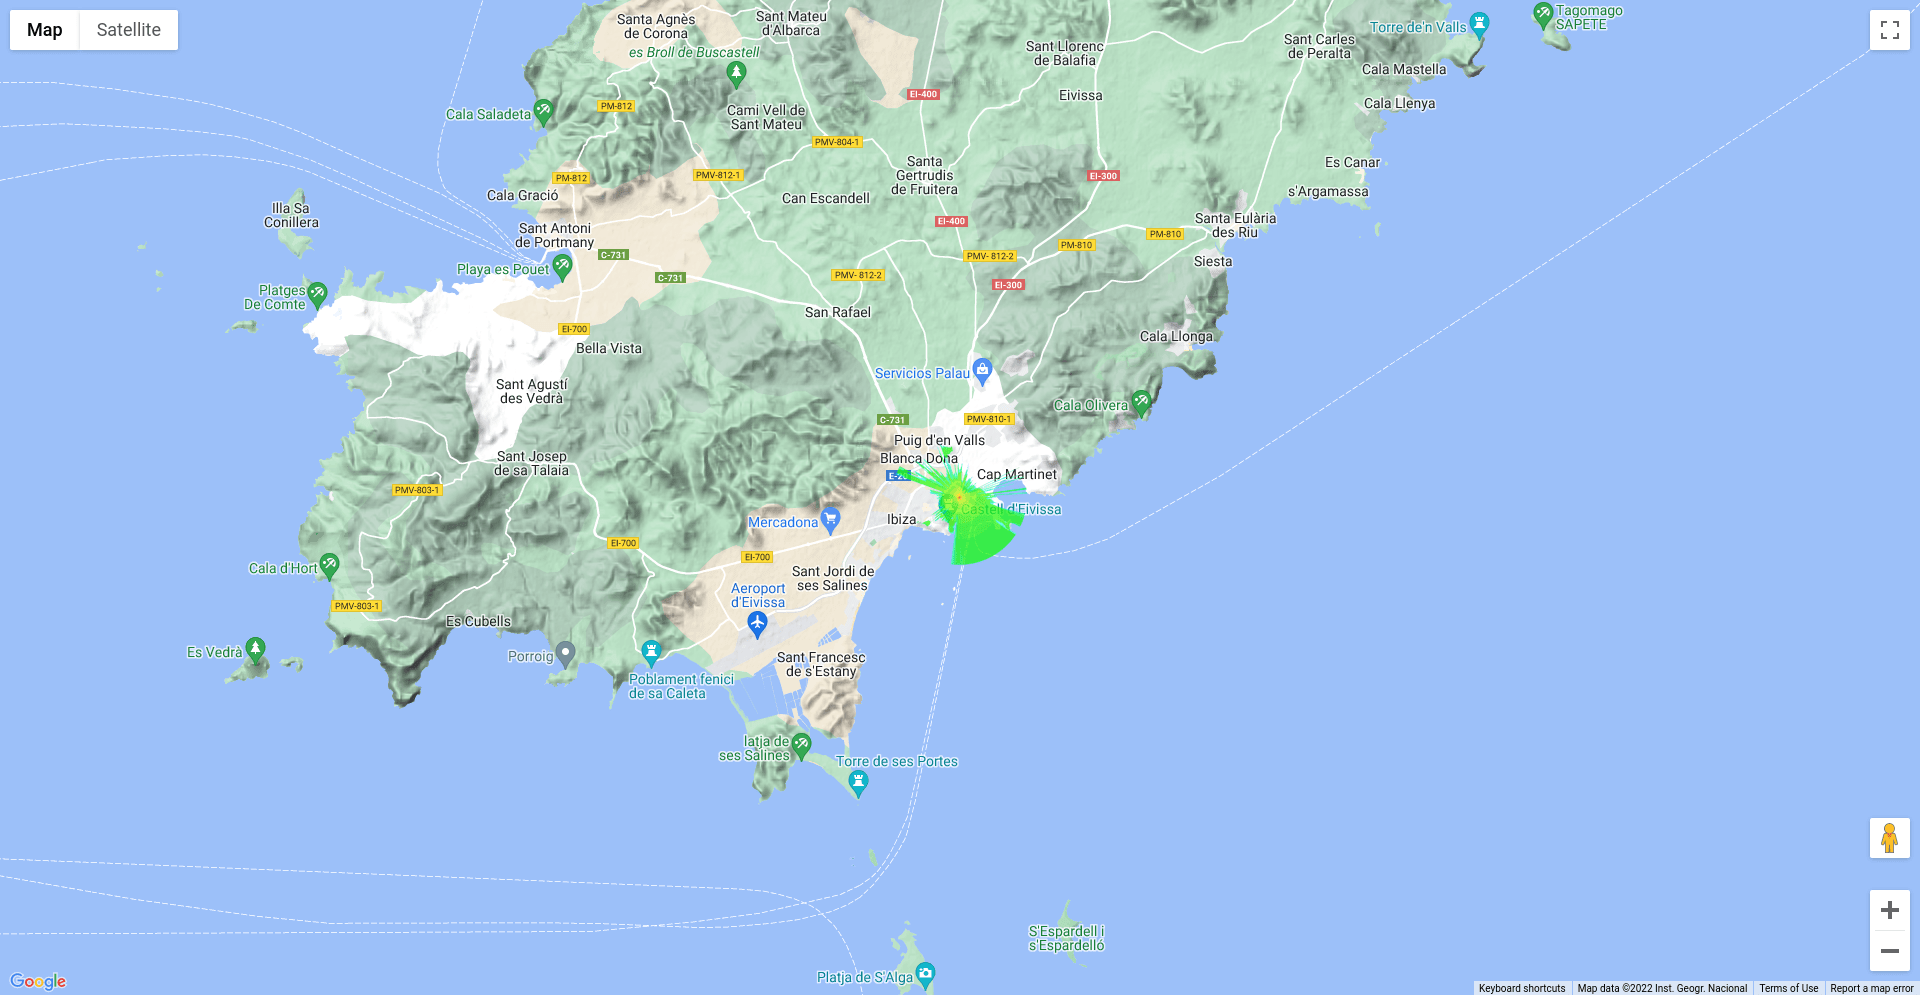
Public Link - lets you view the selected Network(s) in the Google Map.
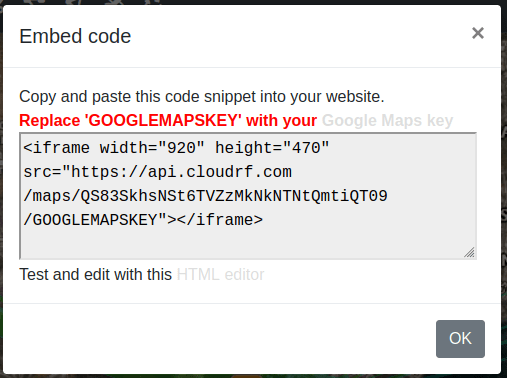
HTML Embed Code - opens a modal window with a code snippet which you can use to embed the layer on your own web page. Please note that here we make use of Google Maps. You should have your own Google Maps API key to properly embed the code.
All the API parameters of the selected network(s) will be displayed here. If you are a developer, you can directly copy paste this to use it in your code.
 Super Layer
The super layer tool lets you generate a super layer composed of different layers. The layers can be from the same network or different networks by using whatever visible layers are on the map.
Layers must use the same colour schema.
Click on Super Layer
button on the Function Menu.The Super layer dialog box will appear.
Merge network
In the Select a network to create a super layer from: field, you can select a network to create a super layer from the drop-down.
In the Super layer name: field, enter the desired super layer name.
Click on the Merge network button
For further information, click here.
The created Super Layer will be highlighted on the map and the corresponding checkbox (enabled) will be displayed.
You may enable or disable the super layer checkbox as per your requirement.
The super layer will be displayed on the map when the checkbox is enabled and will not be displayed when the checkbox is disabled.
Merge visible
The tool will use the layers which are on the map. These must use the same colour schema. Click on the Merge visible button
 Interference Analysis
The Interference Analysis tool lets you generate a new interference layer.
Click on Interference Analysis
button on the Function Menu.The Super layer dialog box will appear.
In the Select a network to analyse for interference: field, you can select a network to create an interference layer from the drop-down.
In the Super layer name: field, enter the desired super layer name.
Click on the Go
 button.
For further information, click here.
The created Interference Layer will be highlighted on the map and the corresponding checkbox (enabled) will be displayed.
You may enable or disable the Interference layer checkbox as per your requirement.
The super layer will be displayed on the map when the checkbox is enabled and will not be displayed when the checkbox is disabled.
 Best Site Analysis
The best site analysis tool is GPU-powered analysis tool to allow you to find the best locations in a large area for a transmitter.
Please note that the response from a best site analysis calculation is NOT a response of signal strength. Instead it is normalised result which takes an input bsa colour schema to show the absolute best locations in an area.
Best Site Analysis is used in the following way:
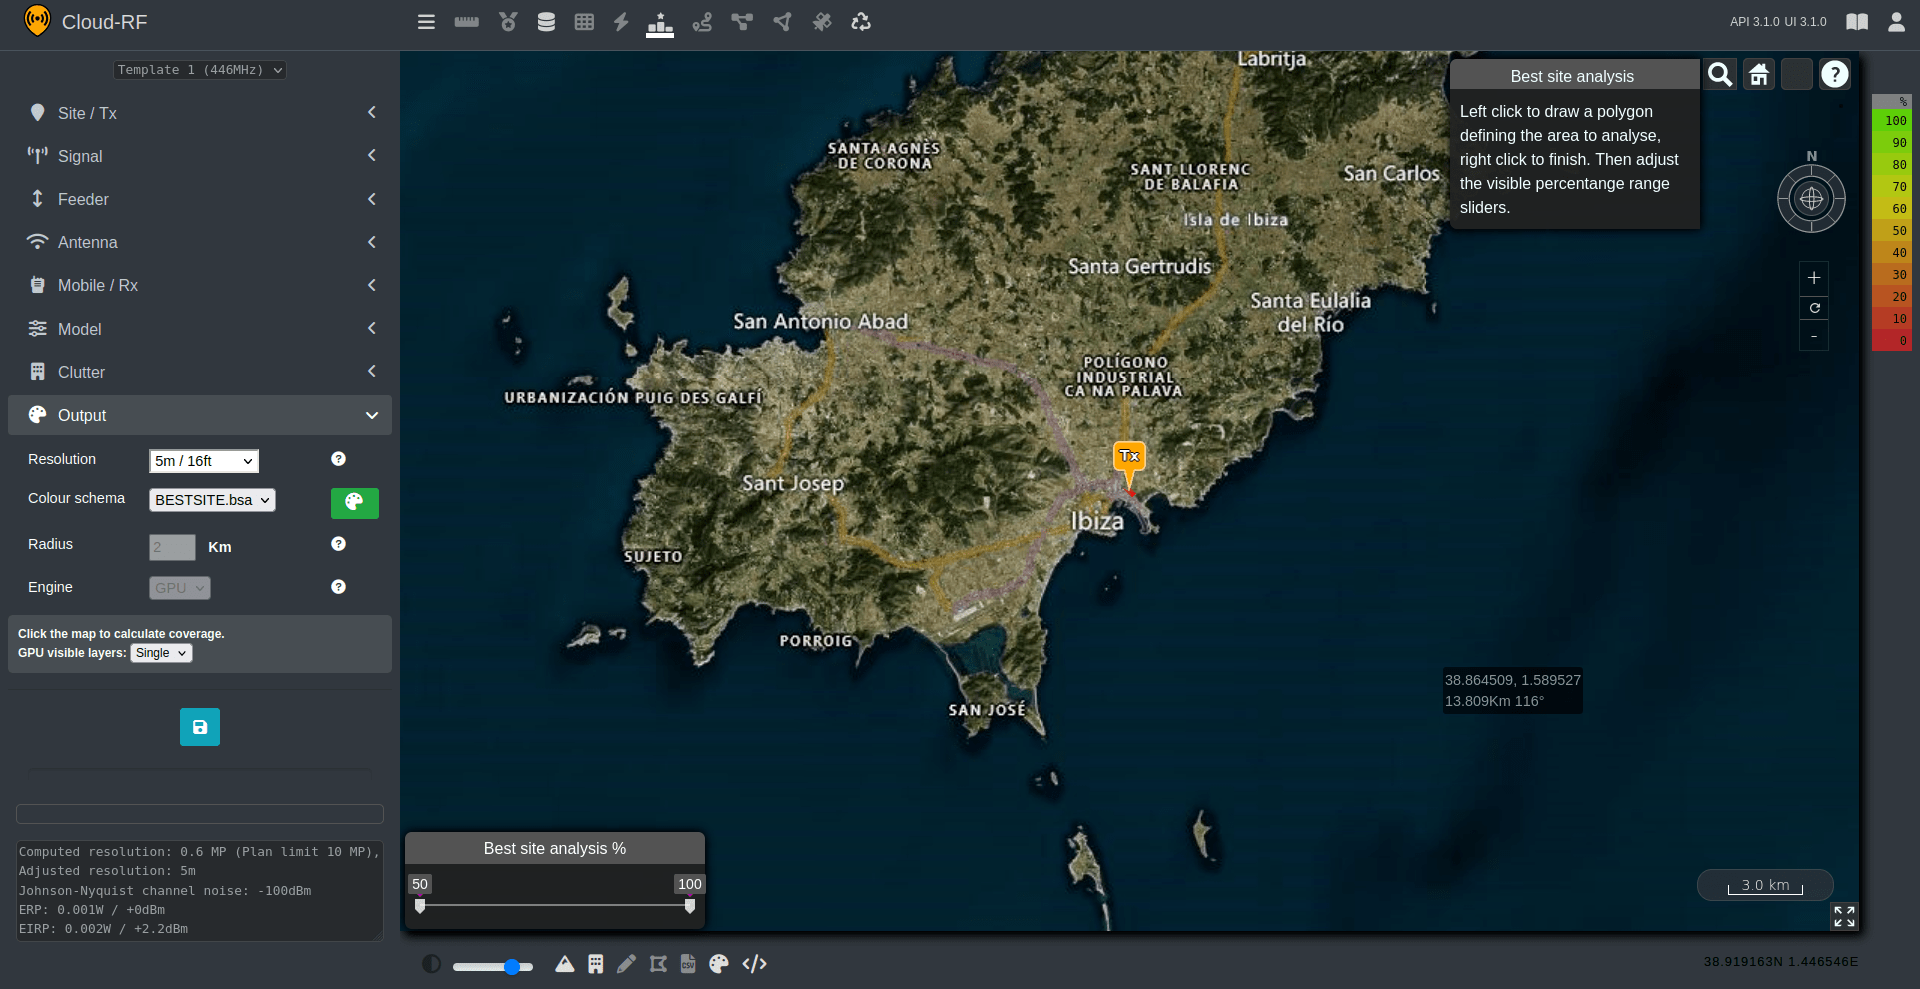
Click on Best Site Analysis
button on the Function Menu.The interface will be converted to Best Site Analysis mode. With this you may notice a number of things:
The small dialog in the top right of the interface indicating you are in Best Site Analysis mode.
The percentage slider in the bottom left of the interface.
“Radius” in the “Output” menu has been disabled.
“Engine” in the “Output” menu has been disabled and set to “GPU”.
“Colour schema” int the “Output” menu has been changed to a
bsacolour schema.
To use the best site analysis tool you can draw a polygon around an area by making use of left-click on the map to set the points of your polygon. Once you have finished drawing your polygon you can right-click to join up to the first point and set an area. Once you right-click your area will be sent to the Cloud-RF API where it will be handled and return your response.
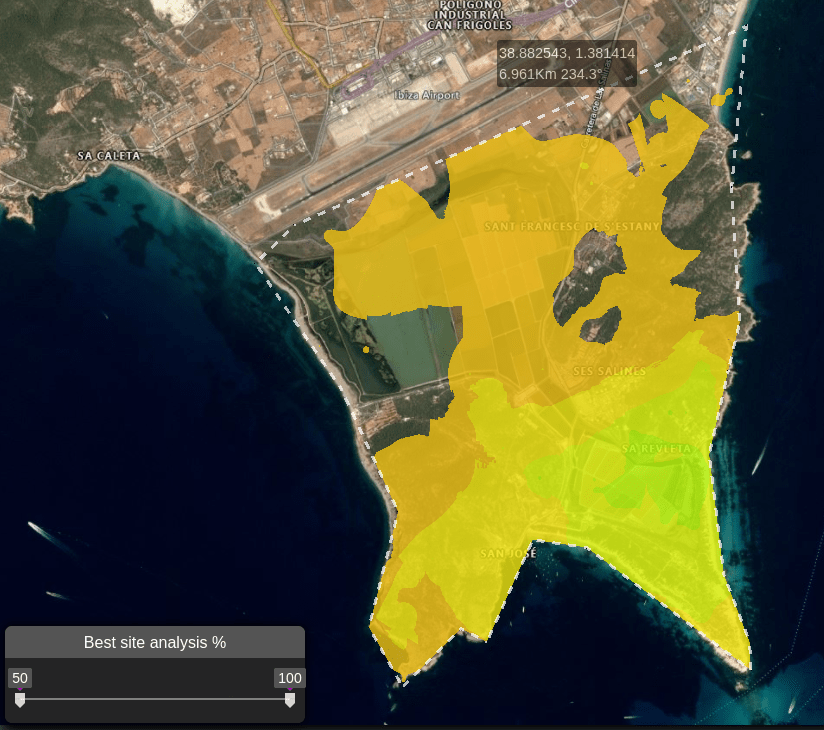
You can then use the slider in the bottom left corner to fine-tune your result and show results between certain percentage thresholds.
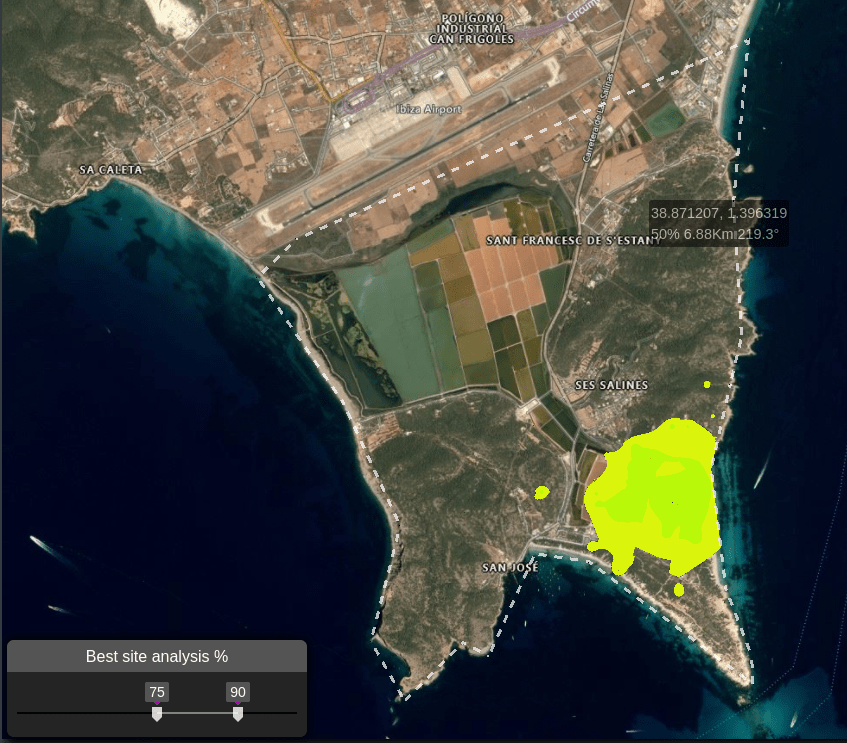
This is useful for showing coordinates which meet your threshold, as it allows you to pinpoint the best locations to place your transmitter.
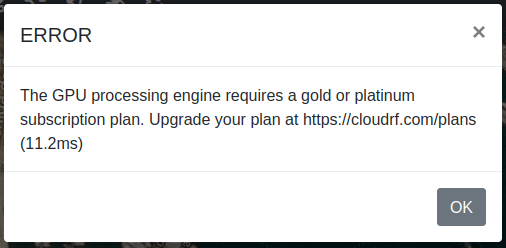
Please note that to make use of the Best Site Analysis tool you will require a Gold or Platinum subscription plan. If you do not have either then you will receive a forbidden message for the reponse.
Satellite NTN LOS analysis (Starlink, Oneweb, Lync)
The BSA tool is ideal for LOS analysis for LEO ground terminals as it can recommend the best site for maximum visibility of the sky. As Low Earth Orbit (LEO) satellites are almost omni-directional in the sky, and fast, isolating one or two is impractical.
To use BSA for LEO, expand the search perimeter beyond the area of interest and then set the receiver altitude to be higher than local obstructions eg. 30m to achieve a steep angle of incidence. As a rule of thumb, set the receiver height to the search radius to achieve a 1:1 (45 degree) angle.
 Route Analysis
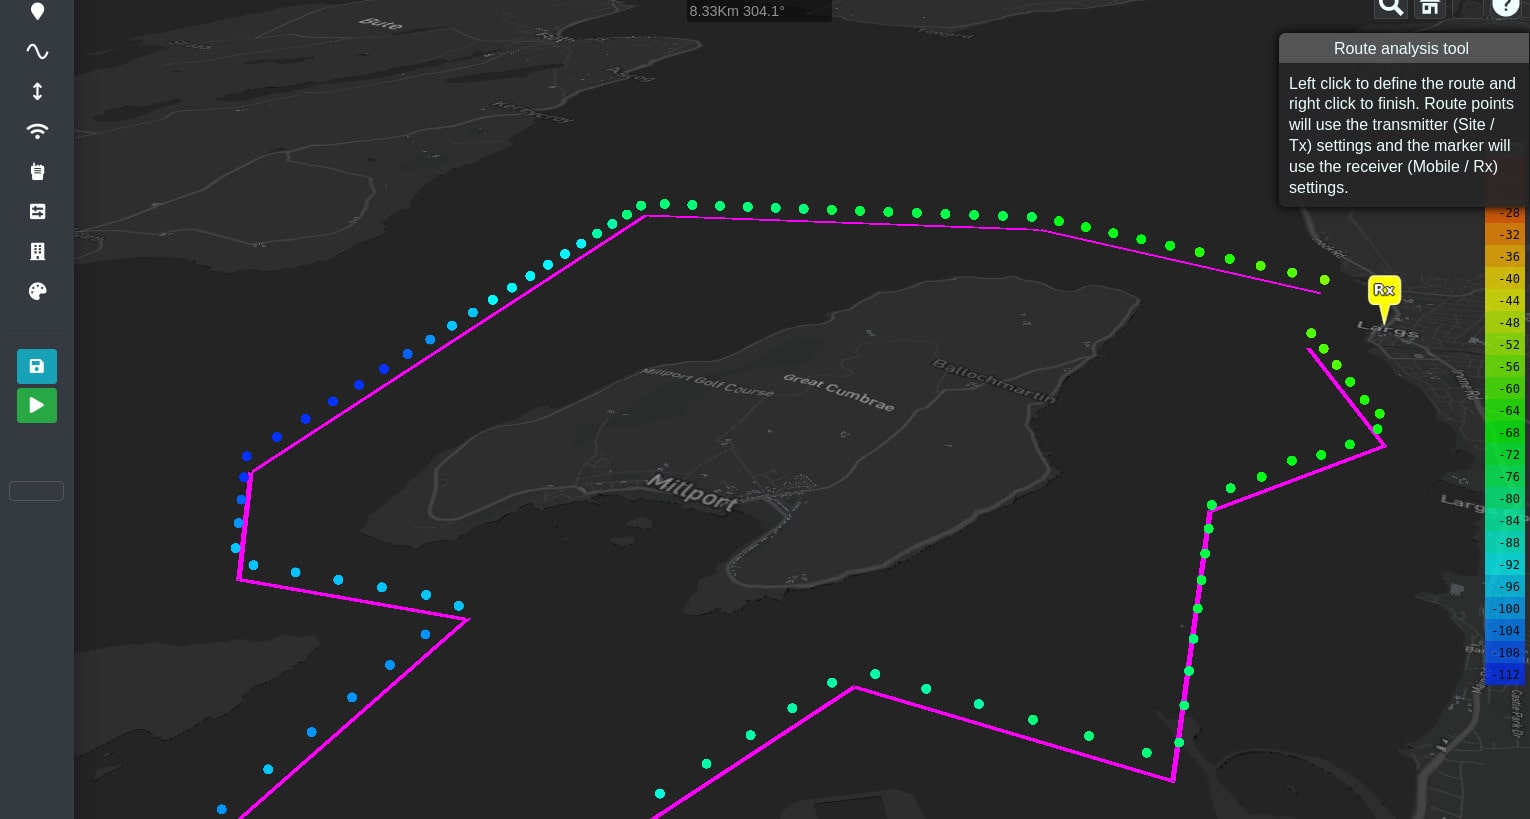
The route analysis function will let you define a route by clicking upon the map. Points along the route will be tested as transmitters back to your map marker’s location which assumes the role of receiver. The transmitter and receiver settings will come from the form.
To add a route:
Left click route analysis button.
Left click points on the map to draw a route. A polyline will appear.
Right click to finish the route. Result will appear after a brief delay.
The points are colour coded based upon the selected colour key.
Click the recycle button to remove the layers.
WARNING - Routes are not saved to your database
 Multipoint Analysis
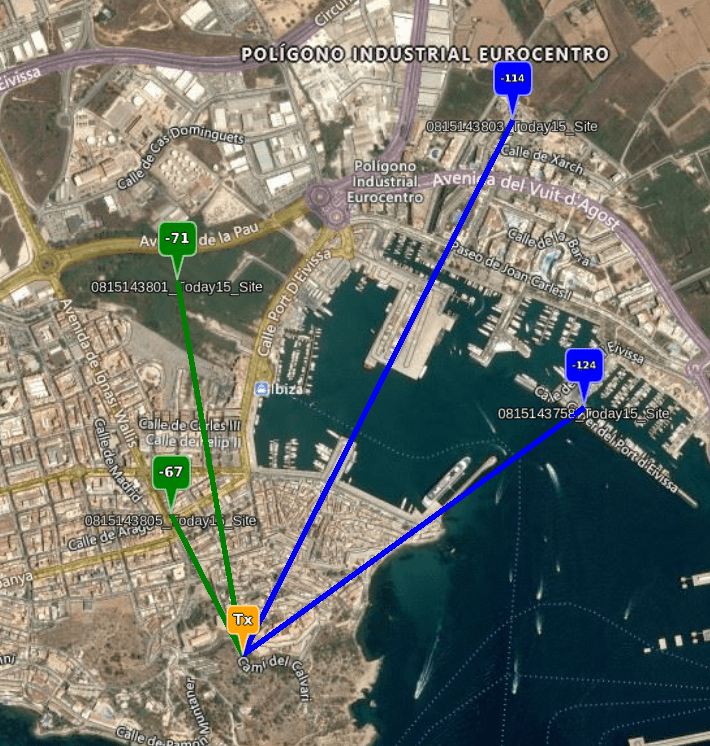
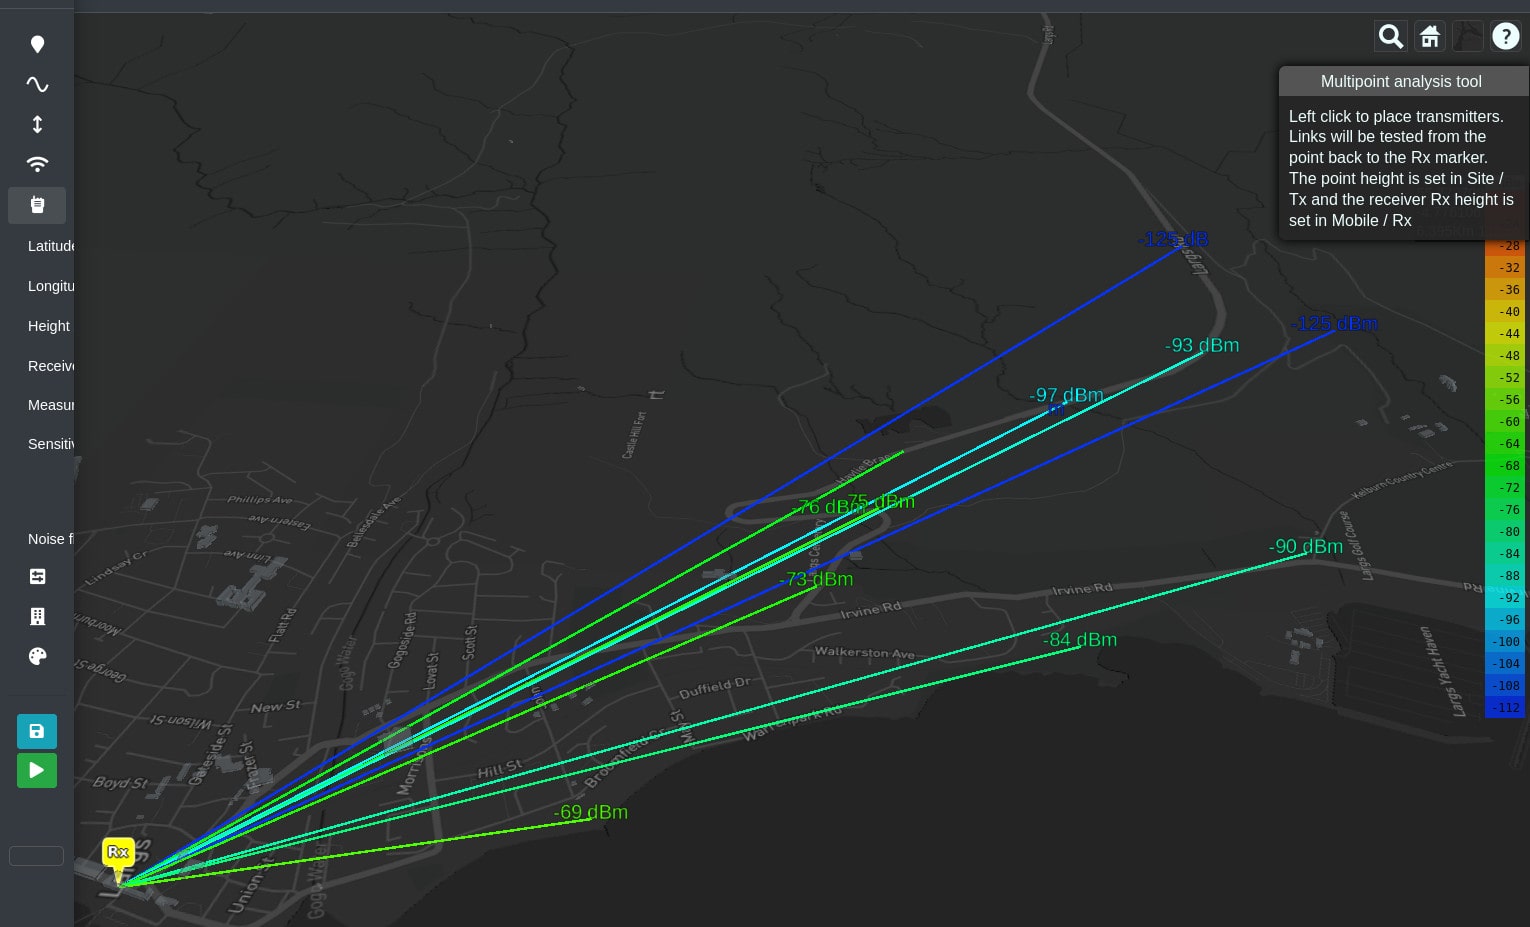
The multipoint analysis function will let you define many links quickly by clicking upon the map. Points will be tested as transmitters back to your map marker’s location which assumes the role of receiver. The transmitter and receiver settings will come from the form.
To add points:
Left click multipoint analysis button.
Left click points on the map to draw links.
The points are colour coded based upon the selected colour key.
Click the recycle button to remove the layers.
WARNING - Multipoint links are not saved to your database
 MANET planning tool
The Mobile Autonomous Network (MANET) planning tool lets you rapidly define a MANET network composed of indepdendent nodes. Nodes can have distinct configurations so you can simulate different radios and/or antennas together.
To create a MANET network:
Define or select a template for your radio
Left click the MANET button.
Left click on the map to add a node / radio.
The nodes will use the settings defined in the input menu. If you need different settings, make the change then add the node.
Drag a node to move it to a better location
Right click a node to delete it
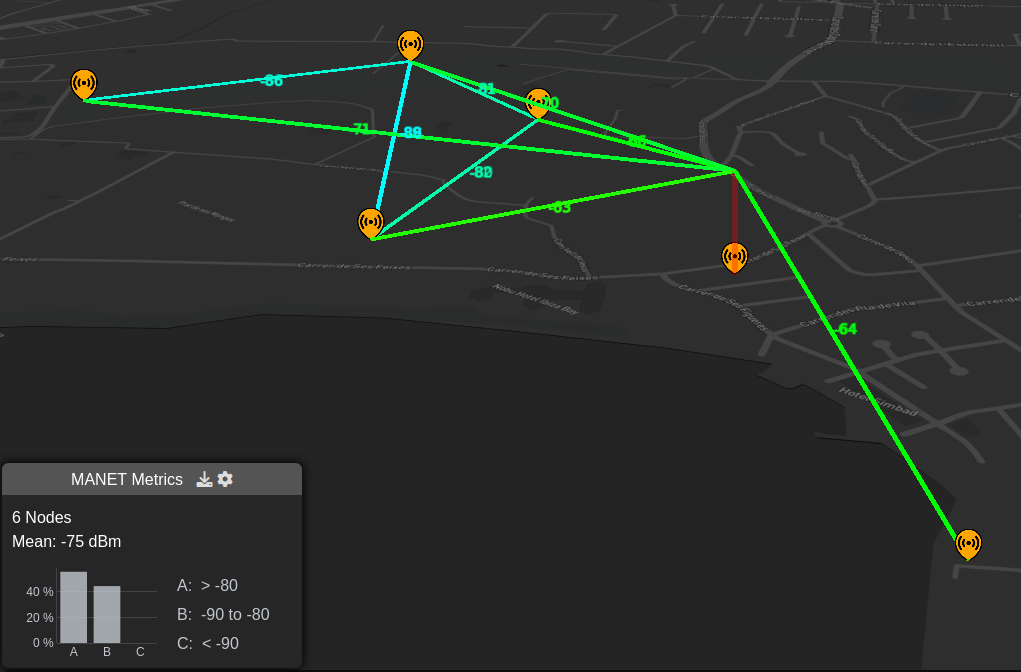
You can configure options for the “MANET Metrics” modal in the bottom left of the screen by clicking on the settings cog icon which is located to the right of this “MANET Metrics” heading.

When you select the settings then this will open up a modal where you can configure a number of settings:
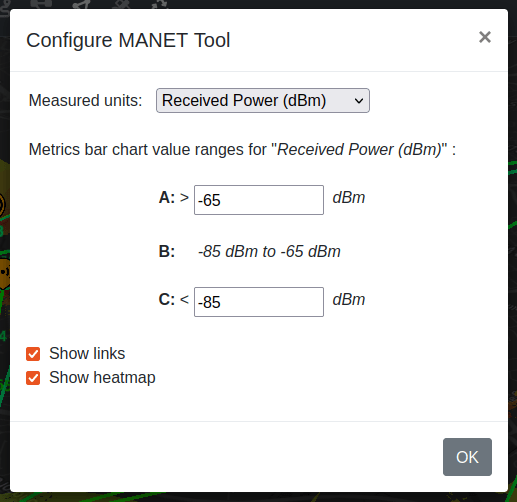
Measured units drop down allows you to select the measured unit which is being used to calculate your MANET network links. Default is Received Power but you can set SNR here also.
The bar chart thresholds allow you to dynamically configure the QoS thresholds for your MANET network so you can model efficiency for different waveforms or requirements eg. video.
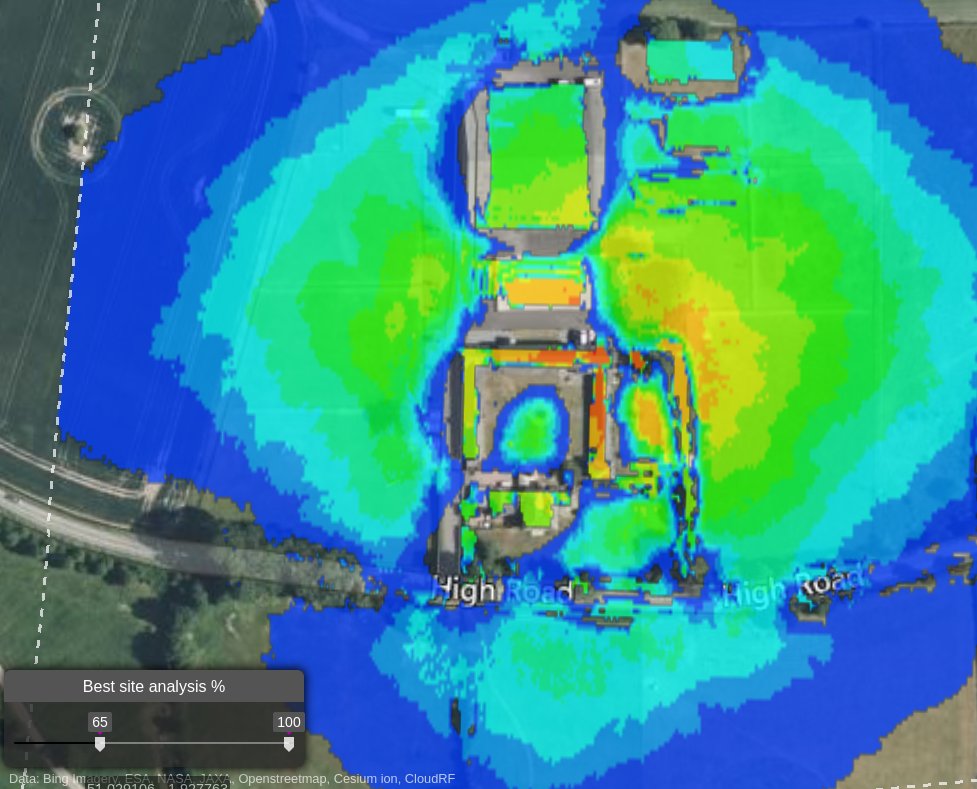
Show links allows you to enable coloured links between network nodes. A link will be shown if it exceeds your receive threshold - otherwise it will not be drawn.
Show heatmap shows you a coverage heatmap for all the MANET network ndoes, out to the defined threshold. This uses the GPU engine so a premium plan is required.
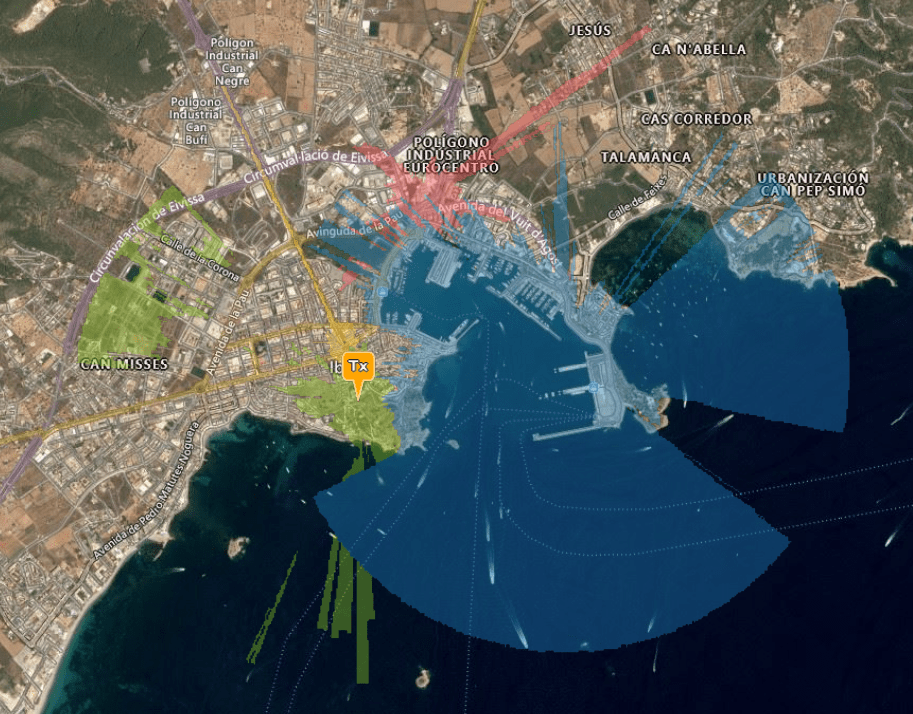
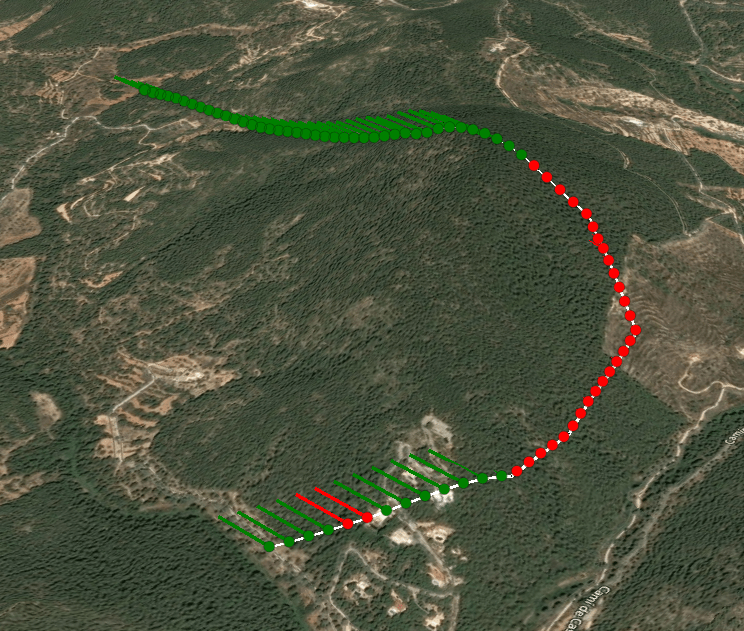
Below shows an example of a MANET network with both links and heatmap enabled.
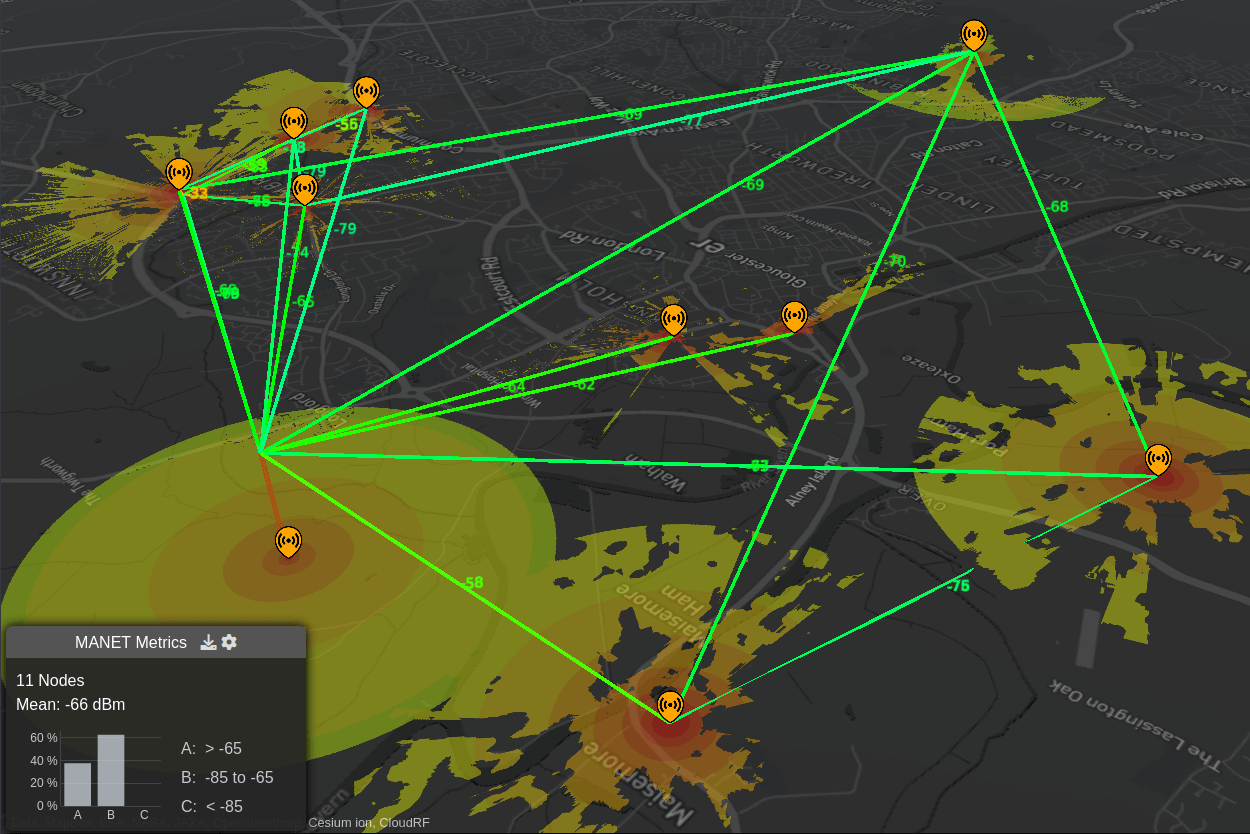
NOTE - Heatmaps are GPU accelerated and require a Gold subscription.
Saving and loading MANET networks
The MANET network is auto-saved after every re-calculation. A re-calculation is performed when a node is added, removed or added. Unlike other API calls, MANET networks are saved to a file instead of the database due to their complexity. This will appear in your archive under the MANET network and can be reloaded by selecting it and choosing to add it to the map.
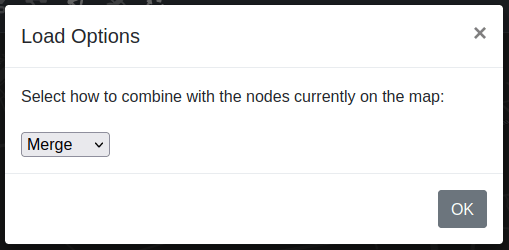
You can choose to reset or merge with existing MANET networks. This allows you to merge two puddles of radios. Please note that you will only be prompted with this window if you have existing MANET nodes already on the map.
Downloading a MANET network
A network can be downloaded as either KMZ, SHP, GeoTIFF, URL or HTML from either the bottom left menu directly after completion, or via the archive using the standard workflow for fetching files.
 Satellite planning tool
The Satellite planning tool lets you test for visibility to over 5400 active satellites from a database. Unlike sat-finder apps this considers topography and clutter to determine visibility.
To test a point for satellite visibility:
Left click SATELLITE button.
Enter search parameters eg. STARLINK in the search popup
The results will be listed. Click the satellite of interest
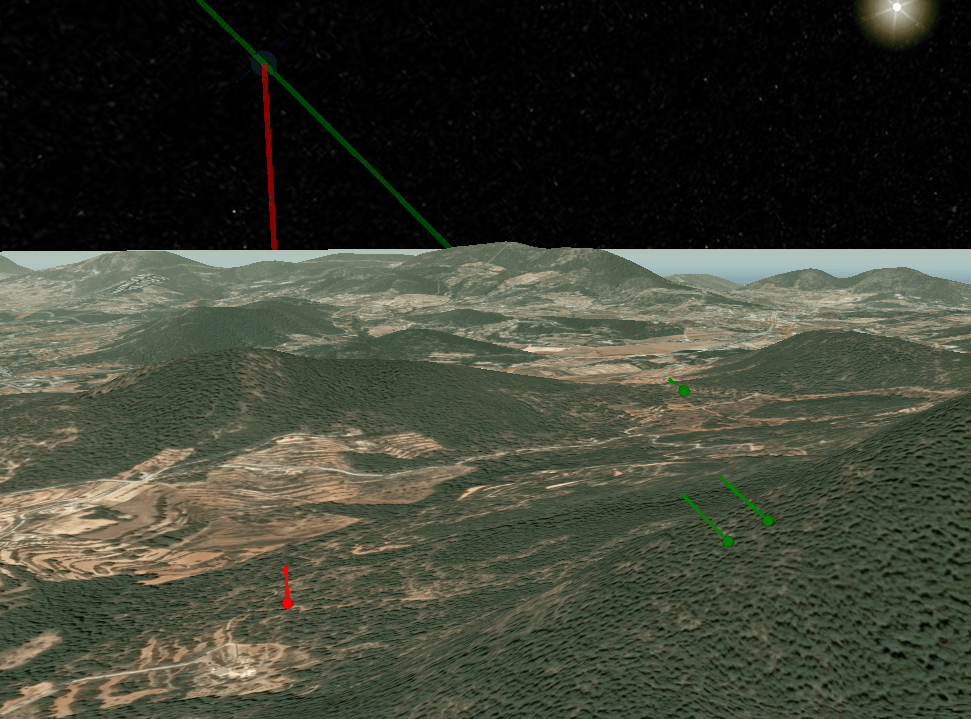
The satellite will now be added above the earth on an orbit which you control the time of using the time slider at the bottom of the screen.
Use the multipoint tool to test points by clicking on the earth.
To test a route for satellite visibility:
Left click SATELLITE button.
Enter search parameters eg. STARLINK in the search popup
The results will be listed. Click the satellite of interest
The satellite will now be added above the earth on an orbit which you control the time of using the time slider at the bottom of the screen.
Use the route tool to test a route by left-clicking a path upon the earth then right clicking to finish.
Satellite NTN LOS analysis (Starlink, Oneweb, Lync)
The Best Site Analysis (BSA) tool is ideal for LOS analysis for LEO ground terminals as it can recommend the best site for maximum visibility of the sky. As Low Earth Orbit (LEO) satellites are almost omni-directional in the sky, and fast, isolating one or two is impractical.
To use BSA for LEO, expand the search perimeter beyond the area of interest and then set the receiver altitude to be higher than local obstructions eg. 30m to achieve a steep angle of incidence. As a rule of thumb, set the receiver height to the search radius to achieve a 1:1 (45 degree) angle.
 Clear Layers
The recycle icon will clear and reset the map of all layers. The layers can be reloaded from within your archive.
To clear the layers on the map:
Click on Clear Layers
button on the Function Menu.All the layers on the map will be cleared and reset.
The required layers can be reloaded from the Archive.